There is a long history of the use of directed causal diagrams to represent hypotheses about causation. Can the mathematics and graphical systems created for statistical causal modeling be adapted to represent and evaluate hypotheses about causal mechanisms and outcomes?
In the causal modeling literature the structure of a causal hypothesis is something like this: variable T increases/ decreases the probability of the occurrence of outcome E. This is the causal relevance criterion described by Wesley Salmon in Scientific Explanation and the Causal Structure of the World. It is a fundamentally statistical understanding of causality.
Here is a classic causal path model by Blau and Duncan indicating the relationships among a number of causal factors in bringing about an outcome of interest -- "respondent's first job".
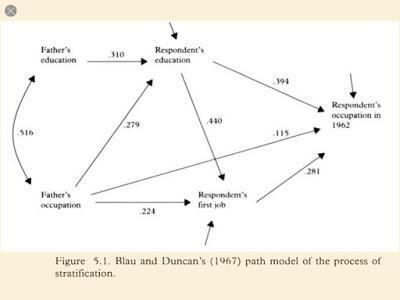
This construction aims at joining a qualitative hypothesis about the causal relations among a set of factors with a quantitative measurements of the correlations and conditional probabilities that support these causal relations. The whole construction often takes its origin in a multivariate regression model.
Aage Sørensen describes the underlying methodological premise of quantitative causal research in these terms in his contribution to Frontiers of Sociology (Annals of the International Institute of Sociology Vol. 11):
Understanding the association between observed variables is what most of us believe research is about. However, we rarely worry about the functional form of the relationship. The main reason is that we rarely worry about how we get from our ideas about how change is brought about, or the mechanisms of social processes, to empirical observation. In other words, sociologists rarely model mechanisms explicitly. In the few cases where they do model mechanisms, they are labeled mathematical sociologists, not a very large or important specialty in sociology. (370)My question here is whether this scheme of representation of causal relationships and the graphical schemes that have developed around it are useful for the analytics of causal mechanisms.
The background metaphysics assumed in the causal modeling literature is Humean and "causal-factor" based; such-and-so factor increases the probability of occurrence of an outcome or an intermediate variable, the simultaneous occurrence of A and B increase the probability of the outcome, etc. Quoting Peter Hedstrom on causal modeling:
In the words of Lazarsfeld (1955: 124-5), "If we have a relationship between x and y; and if for any antecedent test factor the partial relationships between x and y do not disappear, then the original relationship should be called a causal one." (Dissecting the Social: On the Principles of Analytical Sociology)The current iteration of causal modeling is a directed acyclic graph (DAG). Felix Elwert provides an accessible introduction to directed acyclic graphs in his contribution to Handbook of Causal Analysis for Social Research (link). Here is a short description provided by Elwert:
DAGs are visual representations of qualitative causal assumptions: They encode researchers’ expert knowledge and beliefs about how the world works. Simple rules then map these causal assumptions onto statements about probability distributions: They reveal the structure of associations and independencies that could be observed if the data were generated according to the causal assumptions encoded in the DAG. This translation between causal assumptions and observable associations underlies the two primary uses for DAGs. First, DAGs can be used to prove or disprove the identification of causal effects, that is, the possibility of computing causal effects from observable data. Since identification is always conditional on the validity of the assumed causal model, it is fortunate that the second main use of DAGs is to present those assumptions explicitly and reveal their testable implications, if any. (246)A DAG can be interpreted as a non-parametric structural equation model, according to Elwert. (Non-parametric here means simply that we do not assume that the data are distributed normally.) Elwert credits the development of the logic of DAGs to Judea Pearl and Peter Spirtes, along with other researchers within the causal modeling community.
Johannes Textor and a team of researchers have implemented DAGitty, a platform for creating and using DAGs in appropriate fields, including especially epidemiology (link). A crucial feature of DAGitty is that it is not solely a graphical program for drawing graphs of possible causal relationships; rather, it embodies an underlying logic which generates expected statistical relationships among variables given the stipulated relationships on the graph. Here is a screenshot from the platform:
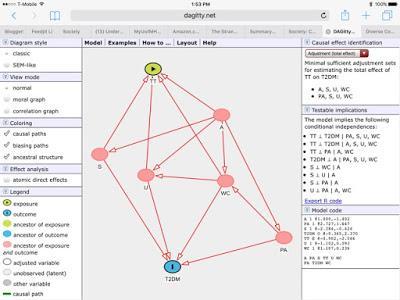
The question to consider here is whether there is a relationship between the methodology of causal mechanisms and the causal theory reflected in these causal diagrams.
It is apparent that the underlying ontological assumptions associated with the two approaches are quite different. Causal mechanisms theory is generally associated with a realist approach to the social world, and generally rejects the Humean theory of causation. The causal diagram approach, by contrast, is premised on the Humean and statistical approach to causation. A causal mechanisms hypothesis is not fundamentally evaluated in terms of the statistical relationships among a set of variables; whereas a standard causal model is wholly intertwined with the mathematics of conditional correlation.
Consider a few examples. Here is a complex graphical representation of a process understood in terms of causal mechanisms from McGinnes and Elandy, "Unintended Behavioural Consequences of Publishing Performance Data: Is More Always Better?" (link):
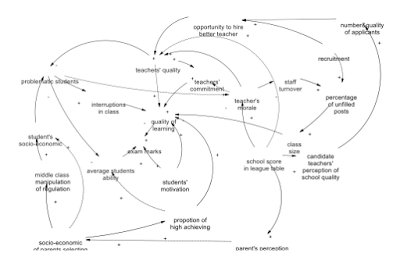
Plainly this model is impossible to evaluate statistically by attempting to measure each of the variables; instead, the researchers proceed by validating the individual mechanisms identified here as well as the direction of influence they have on other intermediate outcomes. The outcome of interest is "quality of learning" at the center of the graph; and the diagram attempts to represent the complex structure of causal influences that exist among several dozen mechanisms or causal factors.
Here is another example of a causal mechanisms path diagram, this time representing the causal system involved in drought and mental health by Vins, Bell, Saha, and Hess (link).
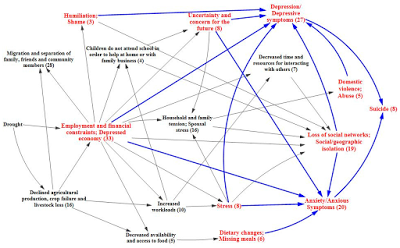
Here too the model is not offered as a statistical representation of covariance among variables; rather, it is a hypothetical sketch of the factors which play in mechanisms leading from drought to depression and anxiety in a population. And the assessment of the model should not take the form of a statistical evaluation (a non-parametric structural equation model), but rather a piecemeal verification of the validity of the specific mechanisms cited. (John Gerring argues that this is a major weakness in causal mechanisms theory, however, in "Causal Mechanisms? Yes, But ..." (link).)
It seems, therefore, that the superficial similarity between a causal model graph (a DAG) and a causal mechanisms diagram is only skin-deep. Fundamentally the two approaches make very different assumptions about both ontology (what a causal relationship is) and epistemology (how we should empirically evaluate a causal claim). So it seems unlikely that it will be fruitful for causal-mechanisms theorists to attempt to adapt methods like DAGs to represent the causal claims they want to advance and evaluate.
