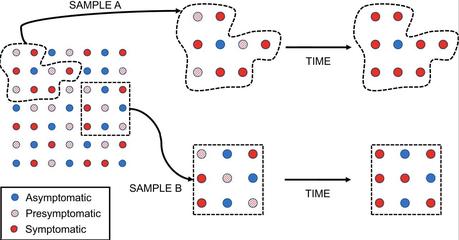
Fisman and Tuite do a commentary on the article by
Sah et al. (open source) that includes a great graphic showing how estimated asymptomatic COVID can be biased in two different ways. I pass on first the graphic and its explanation, and then the Sah et al. significance statement. The bottom line of their meta-analysis is that more than one-third of infections are truly asymptomatic, with greater asymptomaticity in children compared with the elderly:
The... authors address two important biases in the study of asymptomatic infection in their study and note that failure to address these biases distorts estimates of asymptomaticity. The first bias is an ascertainment effect associated with studies including symptomatic index cases in their estimates. The second bias is introduced when studies capture populations of infected individuals at a single time point, which means that presymptomatic individuals (symptomatic cases whose latent period has ended but who have not yet entered the symptomatic stage) are misclassified as asymptomatic. In their review, the authors find that failure to adjust for these biases results in a predictable underestimation of the frequency of asymptomatic infection in the former case, and overestimation of asymptomaticity in the latter.

These biases, and their effects, are described in Fig. 1 (click to enlarge). The circles at the left-hand side of the figure make up a hypothetical population of infected individuals, with a true prevalence of asymptomatic infection (blue circles) of around 33%. If this population attracts notice as a result of an outbreak with notable illness, we may be more likely to sample symptomatic index cases, creating sample A. By contrast, if we are able to sample the population systematically, and obtain a representative sample of infectives, we will create sample B. If we ascertain the prevalence of symptoms at a single point in time, we will misclassify presymptomatic individuals (diagonally shaded circles) as asymptomatic. This will lead to overestimation of the prevalence of asymptomatic infection. In the diagram, 4/9 (44%) of the sample are “asymptomatic” at the first time point in sample A, while 6/9 (67%) are “asymptomatic” in sample B; both samples provide an overestimate of the true probability of asymptomatic infection. If we allow time to pass so that presymptomatic individuals become symptomatic, the probability of asymptomatic infection in sample A drops to 1/9 (11%), a marked underestimate. However, in sample B, the probability declines to 3/9 (33%), which reflects the true underlying probability of asymptomatic infection in the source population.
The Sah et al. significance statement:
Asymptomatic infections have been widely reported for COVID-19. However, many studies do not distinguish between the presymptomatic stage and truly asymptomatic infections. We conducted a systematic review and meta-analysis of COVID-19 literature reporting laboratory-confirmed infections to determine the burden of asymptomatic infections and removed index cases from our calculations to avoid conflation. By analyzing over 350 papers, we estimated that more than one-third of infections are truly asymptomatic. We found evidence of greater asymptomaticity in children compared with the elderly, and lower asymptomaticity among cases with comorbidities compared to cases with no underlying medical conditions. Greater asymptomaticity at younger ages suggests that heightened vigilance is needed among these individuals, to prevent spillover into the broader community.


