What’s an infographic? Consider the following definitions:
A chart, diagram, or illustration that uses graphic elements to present information in a visually striking way.
A chart, graph, or other image accompanied by minimal text, intended to give an easily understood overview, often of a complex subject.
Infographics are the chocolate chip cookies of the internet. (They go down easy– or at least they should.)

Visually striking, minimal text, easily understood, enjoyable.
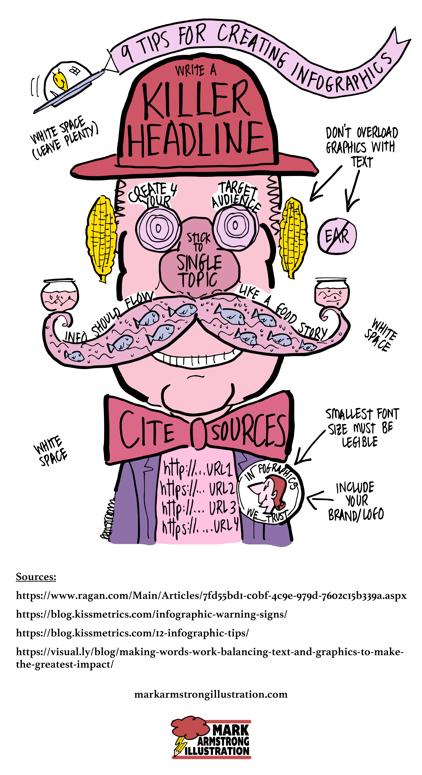
Building on those elements, I came up with 9 tips for creating a infographic. Here they are– in an infographic:


Here are the 9 tips listed roughly in top-to-bottom order:


1. Write a catchy headline. One that gets attention, makes people curious, and gives a clear idea of what the infographic is about.

2. Leave plenty of white (negative) space. A busy infographic is off-putting, hard on the eyes. If that’s the case, people will just scroll on by.

3. Create the infographic for your target audience. You’re a brand trying to engage prospects. Create infographics geared to their needs and interests.

4. Keep text to a minimum. Using visual elements to communicate your data will give it extra impact. Data visualization expert J. Ford Huffman:

“… the text and the image must reinforce each other. Each must show or tell what
the other cannot… Few readers want to read more than they have to read… My hunch is that if a graphic is text heavy, its visual isn’t doing its job well, and/or the writer didn’t know when to stop writing.”
5. Stick to a single topic. Multiple topics can make the infographic cluttered and overlong. Cardinal rule: it needs to be easy to understand.

6. The information should flow like a good story. The graphic elements should guide the reader’s eye through the story from beginning to end.

7. An infographic is like a term paper. You’re making a case by presenting facts and data. You need to vouch for that information by citing your sources. This is typically done by listing the relevant URLs below the infographic.

8. I hand-lettered this particular infographic to give it an organic feel, but most infographics use computer fonts. Use two at the most. Using a lot of different fonts creates disharmony. Make sure the smallest type (font size) will be legible.

9. You’re a brand, and you hope people will share your infographic and give you exposure. So be sure to include your logo and/or your website URL on the infographic.

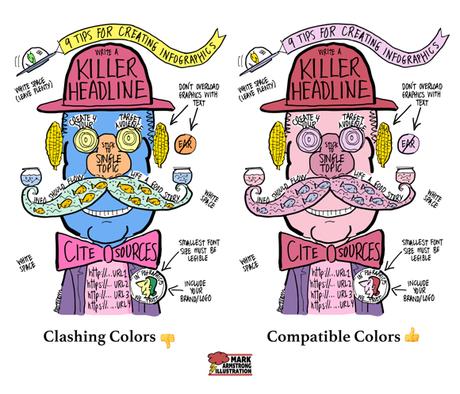
One bonus tip: Limit your palette, i.e., don’t use too many colors, and make sure the colors you do use are compatible with each other. You want your infographic to be visually striking, yes, but you also want it to be harmonious– and that means easy on the eye.


