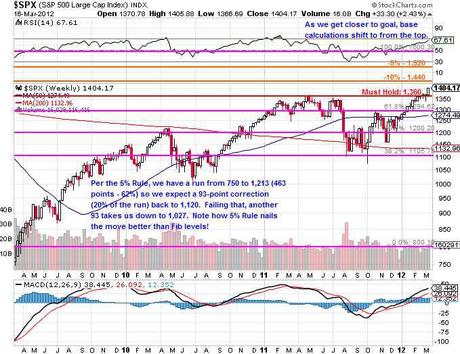
In all that time, we have not had to adjust our Big Chart, which is based on our 5% Rule and has steered us well through the recovery. Now that we are all the way back to our pre-crash highs, it's time, finally, to make a more bullish adjustment. We will be changing our long-standing +10% line at 1,359 to the new Must Hold line at 1,360 – one point off from our original estimate after gathering 36 months of additional years of evidence.

That's right, it turns out our +10% line is still pretty much right on the money, only now we switch our focus to our goal of 1,600 and begin running our numbers off there, rather than from 800. I know I have been (and still am) Fundamentally bearish on the market at the moment – I just think we are making this move too soon – but that is not to say I think the move is unmakeable.

After all, if we're going to be bullish, then our goals should reflect it, right? That makes our new series for the S&P on our Big Chart -20% at 1,280, our must hold line at 1,360, -10% at 1,440 and -5% at 1,520. If we fail to hold the Must Hold line and especially if we fail 1,280, we revert back to the prior Big Chart numbers, where the calculations were made off the bottom. It's like Gravity, as we get closer to 1,600 – it begins to exert more influence. We can also expect the 2.5% lines to become more prominent, as those were 10% lines off 800 and still will probably provide good resistance. This is why you see slowdowns and consolidations as you get near major moves like 100% off the bottom – various Bot programs using different base-lines begin…

