The Champ:IBaker's Dozen 2013
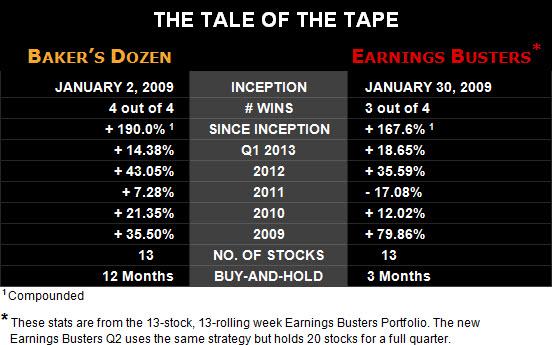
Weighing in with sustained earnings stamina, the BAKER’S DOZEN, the 12-month buy-and-hold champ, has NEVER lost to the market!
In 2012 the BAKER’S DOZEN gained +43%, KO-ing the S&P 500 and the Nasdaq 100 and leaving some of the biggest names on Wall Street—Morgan Stanley, Goldman Sachs, Merrill Lynch, J.P. Morgan—clinging to the ropes. Its compounded annual return over the past four years is+190%.
And this year? Baker's Dozen 2013 has a Q1 performance of+14.38%!
The Challenger: Earnings Busters Q2
Weighing in with powerful quarterly knockouts, EARNINGS BUSTERS Q2 is the only real challenger on the market.
In 2012 Earnings Busters* gained +35.6%—also beating those same Wall Street wizards—and boasts a total compounded return of +167.6% over the last four years. Earnings Busters even beat the Baker’s Dozen in 2009 by 45 percentage points!
And this year? Earnings Busters is in the lead, with a gain of+18.65% for Q1!
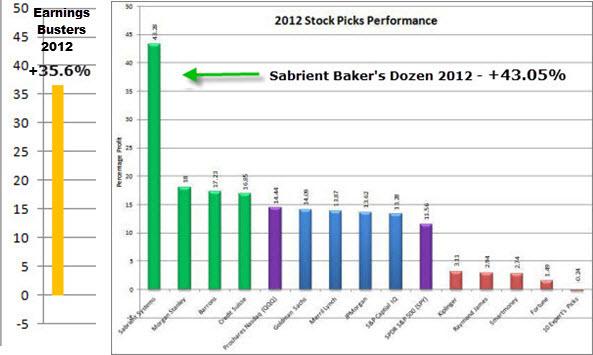
Chart 1, at the bottom of this page, shows the dramatic 2012 performance of
these two Sabrient portfolios against their peers.

Do you want this kind of market-beating performance?
If you missed out on the 2013 Baker’s Dozen or if you don’t like the idea of waiting 12 months for a fresh list of "earnings busting" stocks . . . OR if you just want excellent returns on your investments—
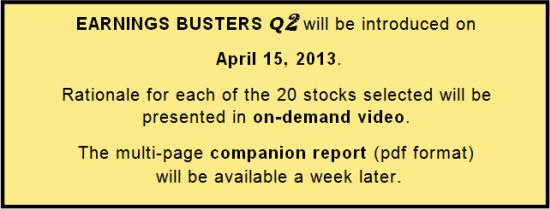
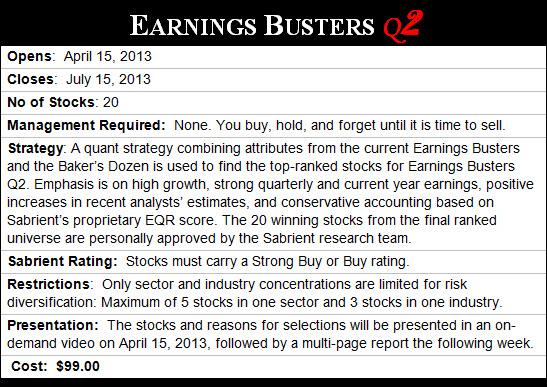
Earnings Busters Q2 is a simpler-to-manage version of the 13-stock, 13-rolling-week version. It is quarterly buy-and-hold 20-stock portfolio: Simply buy the stocks at the beginning of the quarter and sell them at the end of the quarter. The selection strategy is based on the powerful Baker’s Dozen strategy—which gained +43% in 2012—but with a shorter term outlook.

Reserve your access to this exclusive on-demand video and report NOW!
The cost is only $99.00.
SIGN UP NOW for EARNINGS BUSTERS Q2

SIGN UP NOW for EARNINGS BUSTERS Q2
The more active 13-stock, 13-rolling-week
Earnings Busters Portfolio will continue
as part of Sabrient’s Platinum subscription.
Chart 1: 2012 Stock Picks Performance
Those Wall Street wizards that trailed the Baker’s Dozen and Earnings Busters by double-digits in 2012?
We have it on a third-party chart, below, which really is worth a thousand words (Baker's Dozen emphasis added).
We took the liberty of adding a bar for Earnings Busters 2012, for comparison’s sake. You can see for yourself the actual Earnings Busters historical portfolios and performance at http://www.EarningsBusters.Sabrient.com.

CHART 1: 2012 Performance Chart from Performance Review: 2012 'Smart Money' Portfolios."
SIGN UP NOW for EARNINGS BUSTERS Q2 on-demand video and report!

