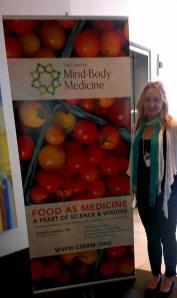
Firstly, apologies for the huge delay in posting… between work, travel and study, unfortunately my blog has been neglected! One of the primary reasons for my recent trip to the States was to attend a Food as Medicine conference in San Francisco. The line-up of speakers was impressive, the content was cutting edge, and it turns out the food was pretty amazing too! I learnt SO much, much of which I’ll hopefully be sharing over the next few blogs.

For today though, I’m going to focus on the ANDI Guide or the “nutrient density” of food, one of the hottest topics of the conference. Originally, the ANDI system was adopted by Whole Foods Market… which became like our second home while we were in the States!
What is the ANDI Guide?
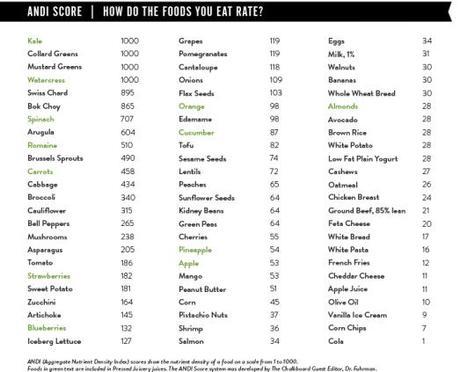
ANDI stands for “Aggregate Nutrient Density Index”, and is a scoring system that rates foods on a scale from 1 to 1000 based on nutrient content per calorie. ANDI scores are calculated by evaluating an extensive range of micronutrients, including vitamins, minerals, phytochemicals and antioxidant capacities.Comparatively, energy-dense foods generally have more calories for the volume of food and generally fewer nutrients.
Basically, nutrient density puts the “Super” in Superfood! This guide is the brainchild of author and MD, Dr Joel Fuhrman. Here is a list of the ratings… highest to lowest. Here is another good guide.

You can probably already see that brightly coloured fruits and vegetables are big winners in nutrient density. Whilst we all know that Kale is healthier than white bread… did you know that sesame seeds are almost twice as nutrient dense as walnuts? And that watercress was such a superstar? That’s where this chart comes in handy.
Keep in mind that nutrient density scoring is not the only factor that determines good health. Some other KEY determinants include;
- The macro-nutrient profile of a food (i.e. fats, carbs and protein). For example, according to the ANDI scale, flaxseeds are twice as nutrient dense as chia seeds. However, once you factor in the high protein and impressive omega 3 profile of chia, they win the battle for healthiest seed!
- The level of processing which a food has undertaken. There is a big difference between a whole tomato, and refined, sweetened tomato sauce!
- The environment which that food has lived or grown in… i.e. grass-fed versus grain-fed, genetically modified versus non-GM, organic versus non-organic, etc
- The way in which a food is cooked or prepared. For example, there’s a big difference in raw red capsicum verses boiled red capsicum as far as the Vitamin C content (and therefore antioxidant content) is concerned.
This being said, nutrient density matters a LOT, and the ANDI scores are an interesting first step to help consumers choose healthier foods. It will be very interesting to see consumer response, and if this kind of approach takes off in Australia. It’s nice to see the micronutrients (vitamins, minerals, phytochemicals, etc) get some attention!
Bottom line = Eat MORE greens and beans, and LESS meat and sweet!
Until next time,
Stacey.
