Solar power in the UK almost doubled last year with plummeting costs causing a boom in the UK’s solar industry.
By the end of 2014, there was almost 5GW of solar photovoltaic panels installed, up from 2.8GW at the end of 2013.
Despite reductions to the Feed-in Tariff by the government, the average price of solar panels has reduced by 70% over the last few years meaning solar is still an attractive prospect to many home owners in the UK and is now much more affordable.
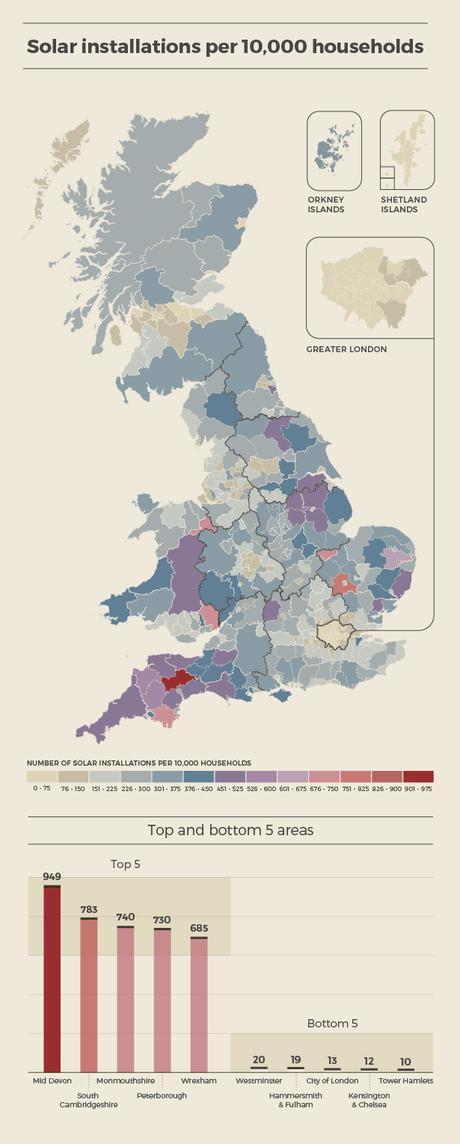
But which regions of Great Britain are leading the boom in solar installations? The map below (click to enlarge) shows which regions of Great Britain have the highest number of domestic installations per 10,000 households based on official data by the government.

Embed This Map On Your site:
<p><strong>An interesting map from <a href="http://www.theecoexperts.co.uk/">The Eco Experts</a> shows the areas in Great Britain with the highest solar installations:</strong></p>
<p><a href="http://www.theecoexperts.co.uk/sites/default/files/filemanager/SolarMapMedium.jpg"'><img src="http://www.theecoexperts.co.uk/sites/default/files/filemanager/SolarMapSmall.jpg" alt='Solar Installations Map By The Eco Experts"' max-width='650' border='0' /></a></p>
<p></p>
Regional Data
Installations per 10,000 homes
South West 378
East Midlands 300
East of England 273
North East 252
Yorkshire & The Humber 244
South East 213
West Midlands 194
North West 178
London 48
WALES 283
ENGLAND 219
SCOTLAND 159
South West of England leading the way
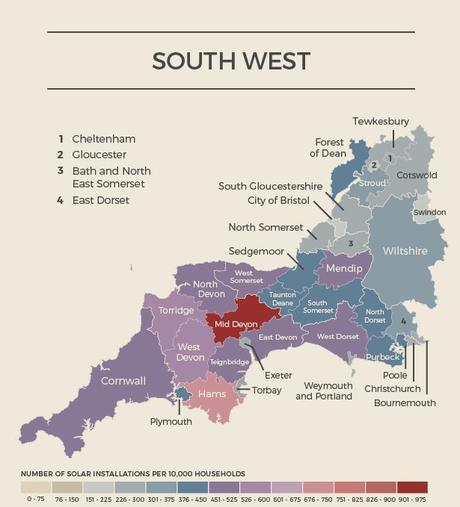
The South West of England is leading the way with 378 installations per 10,000 households. Mid Devon was the best performing local authority with a whopping 949 solar installations per 10,000 households. Eight of the top 15 local authority areas were in the South West of England.

Wales beats England and Scotland
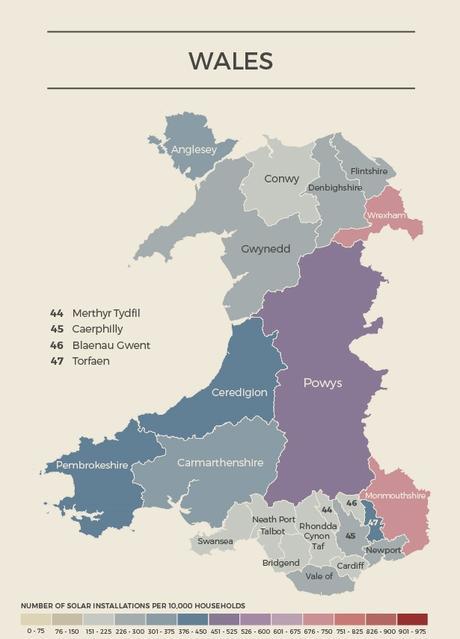
As the data table above shows, Wales has a higher number of installations per 10,000 households (283) than England (219) and Scotland (159). Wales has 2 of the top five local authority areas for GB, with Monmouthshire at position 3 with 740 solar panel installations per 10,000 households, whilst Wrexham is in position five with 685 solar panel installations per 10,000 households.

London not pulling its weight
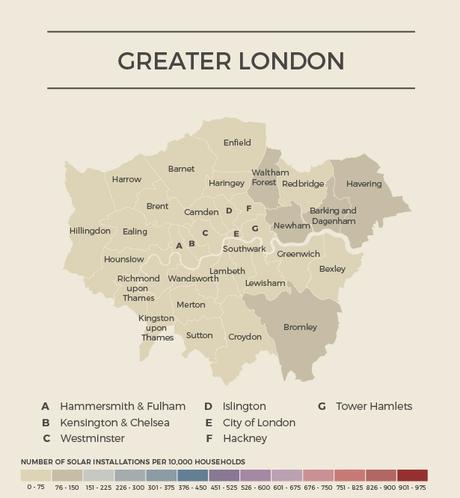
The 14 bottom local authority areas are all within Greater London. Tower Hamlets was bottom of the list, with just 10 solar installations per 10,000 households. London clearly has some catching up to do.

Author's Latest Articles
-
Labour Has Officially Shelved Its £28 Billion Green Investments Pledge
-
European Ski Resorts Suffer From Lack Of Snow After Warmest January Ever Recorded
-
Failures To Insulate Homes And Deliver Clean Tech Have Led To Higher Household Bills, New Report Suggests
-
UK Should Invest £26 Billion A Year In A Sustainable Economy, New Report Says
