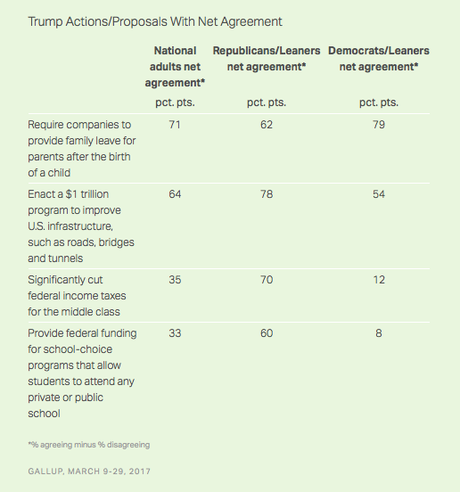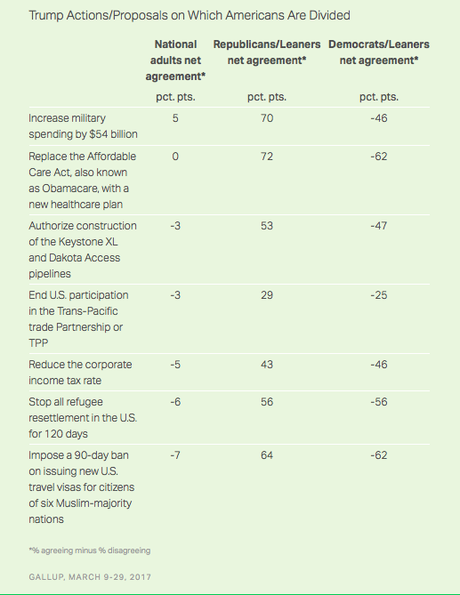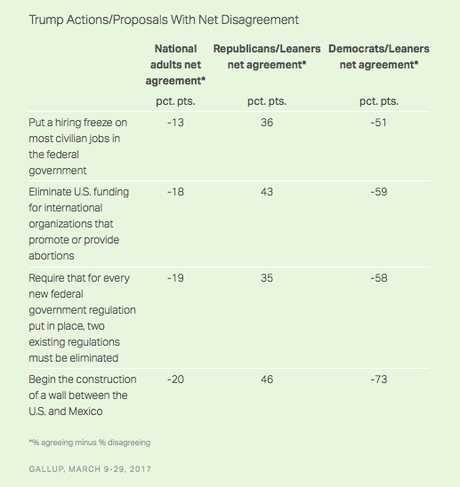


The charts above are from a recent Gallup Poll. It was done between March 9th and 29th of a random national sample of 1,526 adults, and has a margin of error of 3 points. It shows what the public thinks of policies proposed by Donald Trump and the numbers represent the net agreement with those policies (number agreeing minus the number disagreeing). The positive numbers show agreement and the negative numbers show disagreement.
The columns for Democrats and Republicans are no surprise, since one could expect Republicans to agree and Democrats to disagree with Trump policies. The most interesting column is the first one, which shows the feelings of the public in general.

