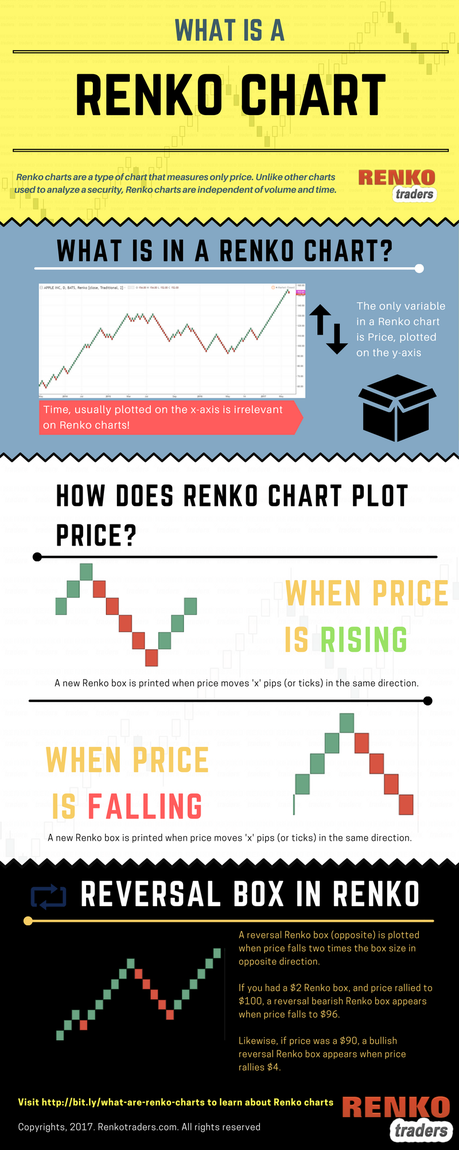
When it comes to analyzing the price of stocks or securities, a chart is used. The most commonly used charts are Candlestick, line or bar chart. A Renko chart is a unique chart because it only accounts for price plotted on the y-axis. Time is not considered with Renko charts.
This infographic explains what is a Renko chart. The very basic!

Embed This Image On Your Site (copy code below):
<div style="clear:both"><a href="http://infographixdirectory.com/finance-money/what-is-a-renko-chart/"><img src="http://infographixdirectory.com/wp-content/uploads/2017/06/what-is-a-renko-chart.png" border="0" /></a></div><div></div>
What is a Renko chart was first posted on June 1, 2017 at 1:00 pm.
©2017 "Infographix Directory". Use of this feed is for personal non-commercial use only. If you are not reading this article in your feed reader, then the site is guilty of copyright infringement. Please contact me at [email protected]

