I found some time to add detail to the location analysis in the Stock Market Update, Forecast, and Outlook for Next Week below. Stock Market Update, Outlook and Forecast for Next Week.
This is important to the overall trading strategy and analysis. If you have been following the forecast and outlook, for technical analysis I have been using the 50 daily moving average as trading context. Choosing this market trading strategy back on June 9 was extremely helpful. Employing that technical indicator setup, presently there have been no market surprises and the short term thesis and trading strategy has not changed.
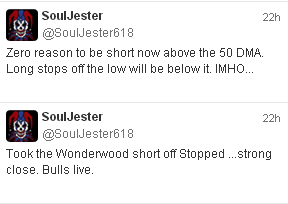
Yesterday I gambled on a Wonderwood short late in the afternoon to see if we would get a 50 DMA failure or not. Per Twitter, the bullish move into end of day stopped out that attempt with the bullish move to close above the 50 daily moving average. I will explain why the trading strategy allowed that attempt below. First, here was the end of day analysis on Twitter (which is located on the right side of the blog and updated as I tweet):

The stop was tight (-.7 SPY points / 7 SPX points) so it was worth a gamble at the line in the sand. On the posted short term Wonderwood plays, that leaves me at 13.93 SPY points since the May 22 top (139.3 SPX points) all posted real time on here (as well as corroborated with posting on multiple locations) and trading in both directions off the top. See Recent Summary here.Stops are just part of the game. If you do not get stopped out on occasion, you are not trying.
Okay, now let me explain the trading strategy behind the move as it relates to the stock market strategy chosen and followed over a month ago per the weekly forecasts and outlook. It is also the market trading strategy that I have been talking about and tweeting about when I get time during my blog break. Here, the play has been the back test of the 50 daily moving average. If it fails, the short term direction is down. If it holds it, the direction is up. Call on June 24 low for 50 DMA Back test into the Pass/Fail Middle of the Chart. The middle of the chart is risky for trading because it produces whipsaws and there is half a chart above and below to be hurt with. That is why one has to honor the location and proceed carefully and slowly in the middle of the chart rather than with big stops and bias. The stock market takes no prisoners.Friday the S&P 500 chart closed above the 50 daily moving average. Per the strategy tool I have been employing for this move, there is now no reason to be entering short here on a short term basis (Wonderwoods--see names of trades) unless and until the market breaks down by moving below the 50 DMA and/or the Friday low. That is why I had the stop where I had it when I speculated into the Friday market close--I was watching the close to see if it failed or not at the 50 DMA. Given that the market closed above the 50 DMA, the market participants' long stops off the June 24 low will be/should now be somewhere right below the 50 period daily moving average. That does not mean the market cannot sell off below the 50 day and resume a bearish trend, nor does it mean that whipsaw in both directions cannot continue, it just means that the stock market has not done so. Accordingly, price should be respected as noted in the original post below given the Friday close.
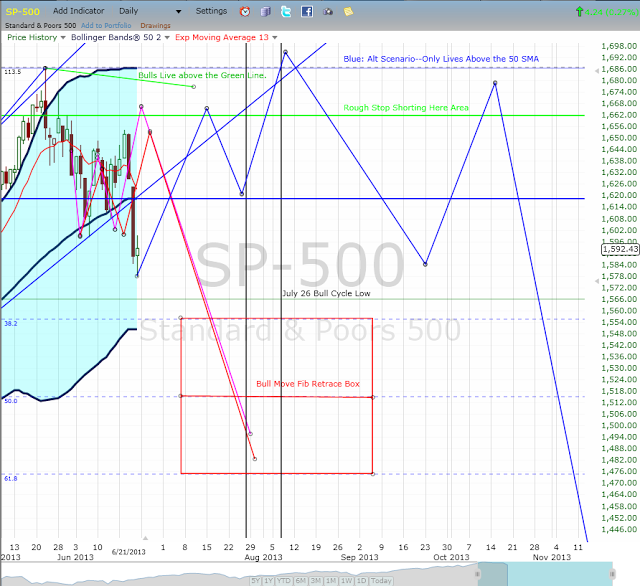
So, it is time to dust off the short term bullish scenarios (so long as we remain above the 50 DMA) to see what the forecast or outlook could look like if the market holds support and runs higher. For the short term bullish scenarios we have the Transport H&S Scenario posted below at Stock Market Update, Outlook and Forecast for Next Week. There is also this stock market scenario (the chart is from June 21) that I laid out if the stock market successfully cleared the 50 DMA. This scenario forecasts a possible larger head and shoulder's being constructed over the course of the summer with the August 7, 2013 (more on that below) being the top of the head in that pattern:

The short term bullish scenarios are important to the longer term stock market thesis for reasons that I stated when I opted to use the 50 DMA/Bollinger Bands for this trade back on June 9. June 9 Post, See Trading Strategy and Long Term Thesis.
Specifically, in that June 9 post above, I noted with respect to the long term thesis that:
"The second thing is whether we need one more high or not prior to the proposed back test/correction of the November 2012 wave up. This I do not know the answer to for certain or with probability. I have been discussing it on private blogs with some good technicians. The scenario is one more wave up above the 1700s versus the top on that November 2012 wave up is already in....I am staying a bit agnostic on the issue and following the strategy as outlined above [50 DMA Band Strategy] to let the market answer that question for me." June 9 Post, See Trading Strategy and Long Term Thesis.
Accordingly, here we are. On holiday trading Friday the broad indexes cleared the 50 DMA. So, as noted in the original post below, is that a head fake, or is it for real? Stock Market Update, Outlook and Forecast for Next Week. There is no way to know. We will find out next week. Only the sands of time know.
However, given the analysis and trading strategy that has not failed at all so far, I will likely not be taking short term Wonderwood shorts above the 50 DMA. The long term thesis of a back test of the November 2012 low, upon which blog performance is and will be measured, is still tracking with or without one more high per all the scenarios, both bearish and bullish. See Recent Long Term Thesis Update Here.
None of this is ego predictions. It is strategy and risk management. It does not mean the stock market will not trade back below the 50 DMA. It does not mean the stock market will or will not get a new high. The "I know the future" calls on the blogosphere are just ego and very detrimental to trading. The point is that the short term bull scenarios live above the 50 DMA. So, above the 50 DMA I respect price and those short term bullish scenarios. From a trading perspective, the simple bollinger trade off the lower band would now be to set the stop below the 50 DMA and see if it can run to the top of the chart.
My gut tells me Friday was a head fake and the stock market may resume down in the near future. But, as noted below, that is just ego crap for those who want to be the one who made the call. Instead, as a function of discipline I will be looking for a higher high as long as (and only so long as) the bulls hold the middle of the chart. However, out of caution, I am also going to wait until next week to make sure this holiday move on Friday above the 50 DMA was for real and not a head fake. There is no rush here. If it is bearish, the stock market will very likely give me a trading setup to take a short term short position when it breaks down. Patience is virtue, or so they say.
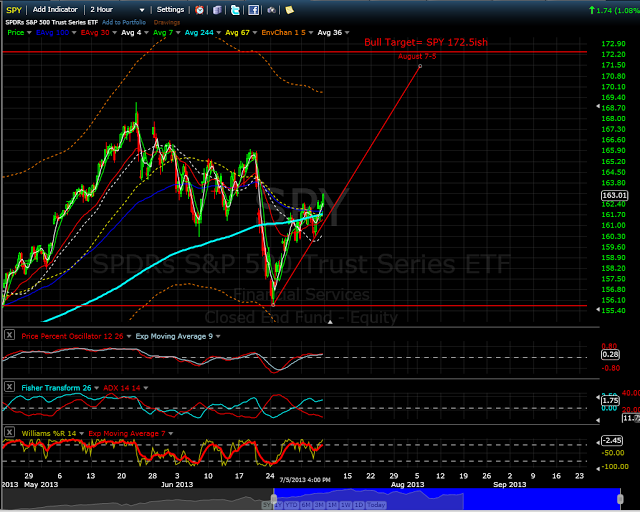
In summary, if Friday was not a head fake, and if the 50 DMA holds as support, the bull target is SPY 172.50 and the timing would be at or near my kooky August 5-7 confluence date which was discussed earlier this Spring. See Item 6, Discussion of May 10/13 and August 7, 2013. And, here is the chart:

So, that is what is in play if this move above the 50 DMA was not a head fake. Ignoring gut feel, intuition, ego calls, et cetera, until the market is trading below that 50 DMA level, the forecast and outlook would remain "up" based upon present data. Now this may bug some people, but this is the middle of the chart and you can believe what I am saying about the chart room that can hurt you on both sides that can hurt a trader from this position or you can ignore it. But I, however, am going to be really careful before I would be short above the 50 DMA or long below the 50 DMA until we know which way this is going to go.
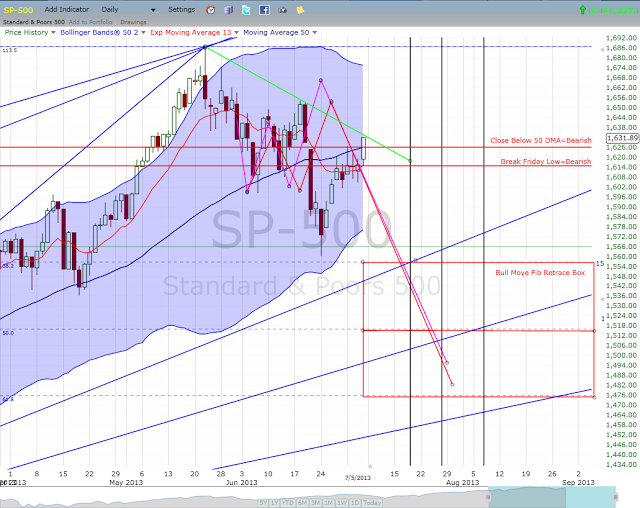
For sake of thoroughness, and in case the words were not enough to draw the picture, the line for return to the short term bearish scenarios are simple (so long as you are not trying to top tick it and are waiting for momentum to follow). First, a close below the SPX 50 DMA would be bearish with a stop at the most recent candle high. Second, a break of Friday's candle low would be bearish with a stop at the most recent candle high. Third, a close below the 13 EMA, which is at Friday's candle low, would be bearish with a stop at the most recent candle high. Fourth, who knows we may get a better setup above the 50 DMA to speculate on ST bearishness. Simple chart:

So, that is why below I said if the market closed above the 50 DMA I would only be looking for a higher high scenario unless the market reversed that move. I see it both ways. I just work hard (we are all sinners) to avoid letting my bias or ego get in the way when trading around an anticipated move. That is what chart trading is supposed to be about.
CONCLUSION On the right side of the blog is additional information of value, including free chart links, links to friend sites, and other sites of interest. I have also included two polls that I created and find the results interesting so far. Please vote if you have not yet voted. Also, this is a free site that I keep largely for my own purposes, but if you like what you see here click on an advertiser to buy a round of beer. Thanks and see you at the end of July.
Peace, Om, SoulJester
