Now, this is important. I was patient (not patient enough) and also entered a speculative short Wonderwood (see names of trades above) US equities trade based off the correlation between USDJPY and the broad US Indexes. I still hold that short trade despite the poor entry and despite that it is above my original stop. Though I am out much of the time until late July, I tweeted my thougths on this: End of Week Market Update, Forecast and Outlook. As always, when I exit a trade I have posted, I post and/or tweet that move. You can see my twitter comments on the right side of this blog. I will post when I exit this trade.
This trade is not a given (none are), but here is why I am still holding that short term bearish equity trade along with the USDJPY short trade. The simple reason is because I am speculating that the correlation is not broke and US equities will follow. I could take a hit on this one if I am wrong. That is part of trading. Let me explain further. Here is the USDJPY (dollar yen) market forecast and outlook chart updated with additional technical analysis:
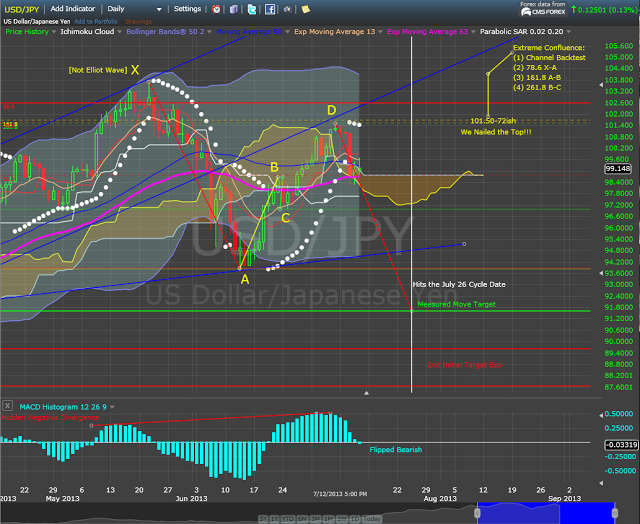
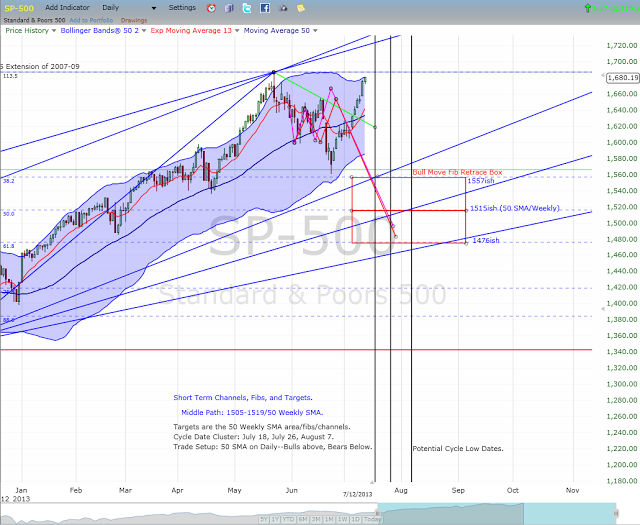
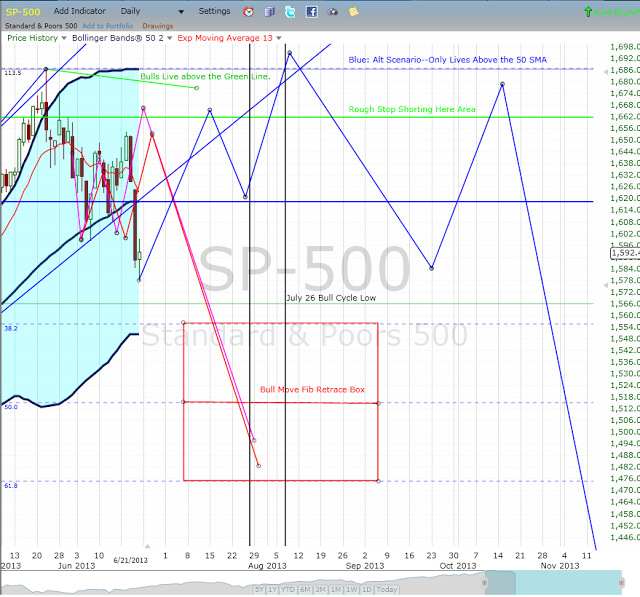
When the market closed above the 50 day moving average on Friday, July 5, there was no reason to be looking to short this market on a short term basis. That was correct: 50 DMA was the Test on which Scenario to Follow. Likewise, the bullish scenario allowed me to call for the market price to back test the 50 DMA off the June lows given the extreme indicator readings. Backtest of the 50 DMA, Break Above We go Higher.
So, here we are. The question now, as I posited in Friday's end of week market outlook and forecast, is whether the correlation in USDJPY and US equities is broken or not. If it is broken, equities could make a high on our July 26 turn date, while USDJPY makes a measured move low. If it is not broken, equities could sell off into a big July 26 low along with USDJPY per the bearish forecast.
Is there an market indicator that says US Equities might sell off here? Yes. Here is the HI LO indicator:
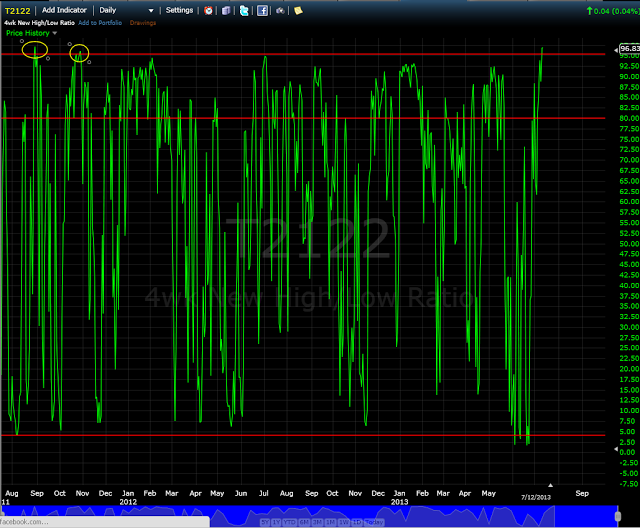
The last two times we hit this extreme was August 30, 2011 and October 28, 2011, both which preceded a decent size sell off in US Equities. Now, as you know if you follow me, I am not around much this month but plan to be back more regularly end of July. I have not had the time to do a full study of the indicator occurrences above. Accordingly, for purposes of forecast and outlook, presume it is not a given that large sell always occur from this HI LO reading (and do your own study!). But that is an extreme condition that produced stock market sells the last two times it occured.
Setting the indicator aside, and the USDJPY correlation aside, is there anything about price that would suggest a sell off is possible from this price location? Yes. Small Caps (IWM) has hit an extreme price deviation, including being above its daily bollinger bands. Stock Market Chart:
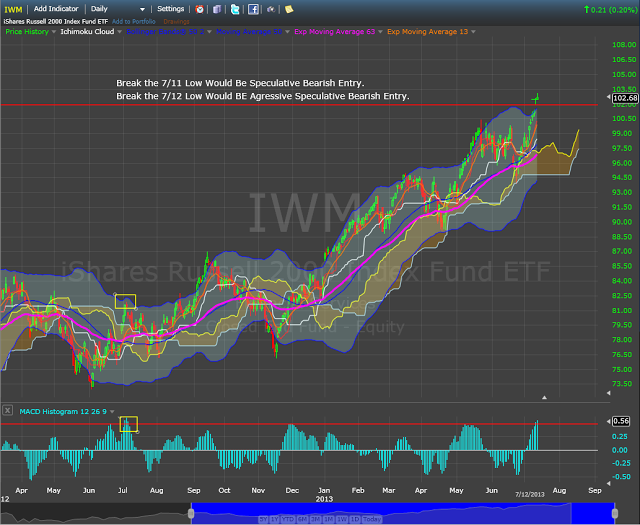
Finally, as noted in the market chart above, we do not have a breakdown or entry in US Equities because we keep getting higher daily lows and higher daily highs. That means, as was indicated when the trade was taken, that shorting into this in equities is SPECULATIVE. It is also counter trend because of a lack of breakdown entry and because we are above all significant moving averages (i.e., we are in an up trend).
The play here for me was (and is) to take a shot on the extreme indicator readings, the price extremes, and the USDJPY correlation for the bearish sell off into the July 26/Aug 7 cycle period. This is speculative, but I wanted to lay out the case and thoughts behind what I have been tweeting and briefly posting about the past 7 days.
CONCLUSION On the right side of the blog is additional information of value, including free chart links, links to friend sites, and other sites of interest. I have also included two polls that I created and find the results interesting so far. Please vote if you have not yet voted. Also, this is a free site that I keep largely for my own purposes, but if you like what you see here click on an advertiser to buy a round of beer. Thanks and see you at the end of July.
Peace, Om, SoulJester
