
Public Policy Polling has released their latest presidential poll. This time they queried the voters in Virginia. The survey was done between July 13th and 15th of a random sample of 1,170 registered voters in Virginia, with a margin of error of 2.9 points. The margin of error for the 502 Republicans is 4.4 points, and for the 409 Democrats is 4.9 points.
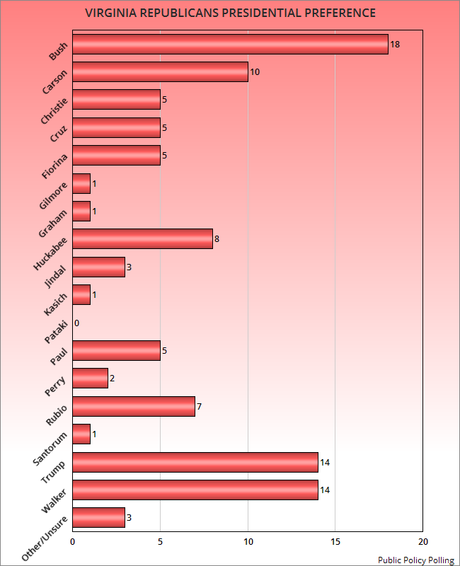
Donald Trump didn't finish first in this survey. That honor went to Jeb Bush, who had the support of 18% of Virginia Republicans. But Trump was among the leaders, finishing in a tie for second with Scott Walker at 14% support. No other candidate could get into double-digits. Huckabee with 8% and Rubio with 7% came the closest.
I am a bit surprised at what has happened to candidates that were once considered to be among the leaders -- like Cruz, Rubio, Huckabee, and Paul. They seem to have been the losers of the Trump phenomenon, falling back into the "second-tier" of candidates. Cruz, Huckabee, and Paul were benefitting from the anger in the base, but Trump seems to have co-opted that anger vote.Can Trump go the distance? He may be making a mistake by attacking other Republicans right now. If he does fall back, can Cruz, Huckabee, and Paul regain their status. We'll just have to wait and see. Frankly, I don't know the answer to those questions.
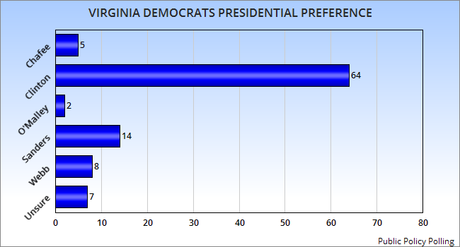
There's no question who the favorite is among Virginia Democrats though. Hillary Clinton has a 50 point lead over Bernie Sanders (64% to 14%) -- and that's without Biden being included as a choice. Some had thought Biden supporters might go to Sanders, but that certainly didn't happen in Virginia.
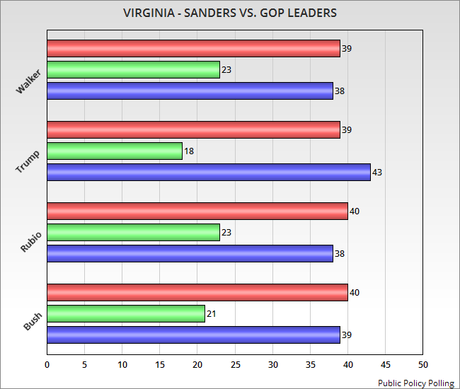
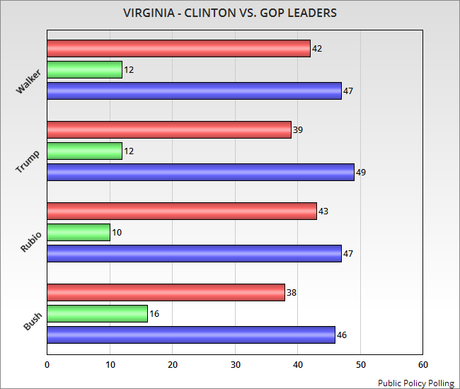
Another interesting aspect of this PPP survey was that they matched both Sanders and Clinton with the three leading Republicans (and Rubio). Clinton would beat any of the four, while Sanders would beat only Trump. There are a lot of "unsure" though, and that could mean that Virginia voters are open to Sanders showing he could be a credible candidate for the Democrats. He just hasn't done that yet.


NOTE -- On these two bottom charts, the blue represents the Democratic candidate and the red represents the GOP candidates. The green shows the number of voters who are unsure who they would vote for.

