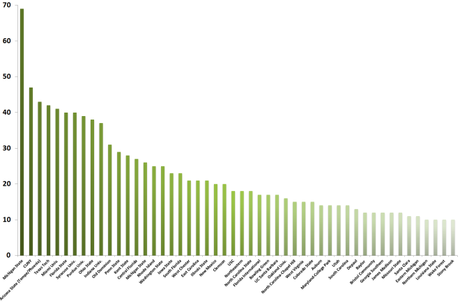
Here’s a list of the universities and colleges best represented at the 2015 CCCC conference. I used NLTK to locate named entities in the CCCC program, so the graphs simply represent a raw count of each time a university appears in the program. Some counts might be inflated, but in general, each time a school is named = a panel with a representative from that school.
The graph shows only those schools that were named at least 10 times in the program (i.e., the schools that had at least 10 individual panels). Even in this truncated list, Michigan State dominates. Explanations for this gross inequality in representation are welcome in the comments.

CCCCColleges (Excel file)
Program (in .docx form because WordPress doesn’t allow .txt files)
