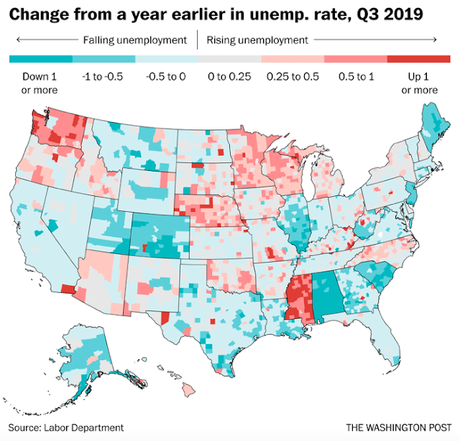
The chart above, from The Washington Post, shows the unemployment rate in the United States by state and county according to the U.S. Labor Department. The pink/red areas are those where the unemployment rate is actually higher now than it was a year ago.
Note this includes some swing states that Trump needs to win in 2020 -- Like North Carolina, Arizona, Wisconsin, Michigan, and Minnesota. Will this affect the next election if this trend continues (and it is likely to continue)?
Here is part of what The Washington Post reported:
Nationally, the economy looks healthy, with solid growth, stocks at record highs and an unemployment rate of 3.6 percent, near historic lows. But unemployment isn’t falling for everybody. New data released last week by the Labor Department reveals just how many places are struggling. In more than 1,000 counties, or about one in three, the unemployment rate is higher than it was a year ago. That includes all 72 counties in Wisconsin and all 10 in New Hampshire, as well as most in Michigan, Minnesota and North Carolina. The numbers can be volatile from month to month, but this trend remains even if you look at entire quarters or years.

