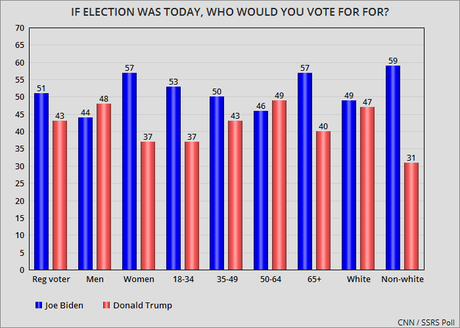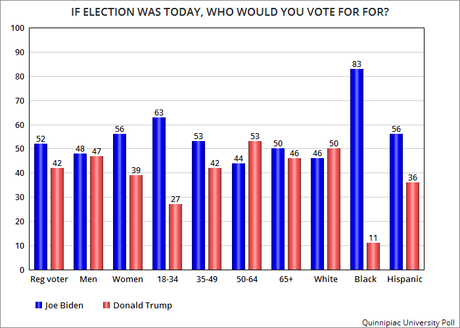

The top chart reflects the results of the Quinnipiac University Poll -- done between August 28th and 31st of a national sample of 1,081 likely voters, with a 3 point margin of error.
The bottom chart reflects the results of the CNN / SSRS Poll -- done between August 28th and September 1st of a national sample of 1,106 voters, with a 3.8 point margin of error.

