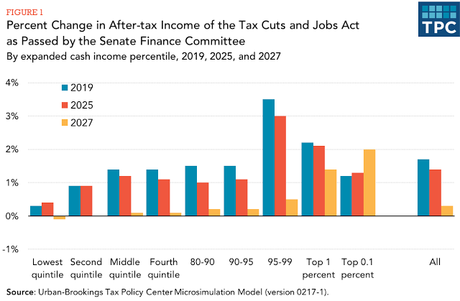
The chart above and the analysis below are from the Tax Policy Center:
The Tax Cuts and Jobs Act is working its way through Congress. On November 9, the House Ways and Means Committee passed a version of the Tax Cuts and Jobs Act(link is external) and the entire US House of Representatives passed its version of the bill (link is external)on November 16. The Senate Finance Committee also passed its version of the Tax Cuts and Jobs Act(link is external) on November 16. The Tax Policy Center has released distributional estimates of the Tax Cuts and Jobs Act to reflect the bill as passed by the Senate Finance Committee on November 16, 2017. We find the bill would reduce taxes on average for all income groups in both 2019 and 2025. In general, higher income households receive larger average tax cuts as a percentage of after-tax income, with the largest cuts as a share of income going to taxpayers in the 95th to 99th percentiles of the income distribution. On average in 2027, taxes would rise modestly for the lowest-income group,chang e little for middle-income groups, and decrease for higher-income groups. Compared to current law, 9 percent of taxpayers would pay more in 2019, 12 percent in 2025, and 50 percent in 2027.
TPC has also released an macroeconomic analysis of the bill as passed by the US House of Representatives on November 16, 2017. We find the legislation would boost US economic output by 0.6 percent of gross domestic product (GDP) in 2018, 0.3 percent of GDP in 2027, and 0.2 percent of GDP in 2037. The resulting increase in taxable incomes would reduce the revenue loss created by the legislation by $169 billion from 2018 to 2027 and by $136 billion from 2028 to 2037. Including macroeconomic effects and interest costs, the legislation is projected to increase debt as a share of GDP by just over 5 percent in 2027 and by just over 9 percent in 2037.

