Visual content makes the difference between creating good content and representing your content in an appealing manner. Infograph creation today, is one of the best ways to increase engagement and connection with your readers.
Visual (infographic) representation provides well structured content and can be easily digested by readers than almost any other presentation methods.
With infographs, you can quickly present your finding and research without compromising your audience. As new and old companies find this as an effective way of communicating online and mobile, you can start testing out the waters on how to get your own infographs created.
To help you get in on the right foot, I have researched and complied Top 10 Infograpic tools you can use to get started.
1. Visualizeme
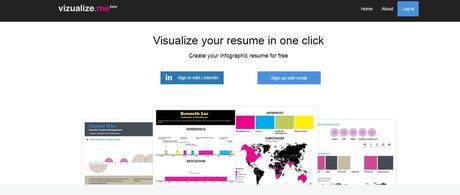
Visualize.me can be used to create amazing and beautiful Infographs for any project. One thing which I really like about this web app is that you can register this website using your Linkedin profile and guess what, you can convert your LinkedIn profile into a beautiful Infographic in one click.
With over 500,000 infographics created, Vizualize.me is one of the most used infographics maker for stunning visual resumes.
2. Venngage

Venngage will transform your boring data into stunning Infographic reports. One thing which I really like about this web service is that you can also check who is viewing your created Infographic. Over 100+ infographic templates on Venngage for you to fully customize in any industry or topic.
To effectively us Vennage, you can choose from a 100+ infographic templates and start creating your own with no coding needed.
3. Creately
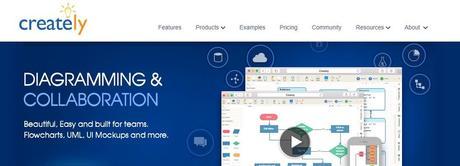
Using Creately you can build organized concept maps, flowcharts, and diagrams for free. Basically these have a subscription pack, but still free member can create up to 5 Infographics for free. Creatly, will help you easily draw diagrams online without any coding.
You can also draw any diagram type by using free templates and examples provided in the platform. With over 50+ types of diagrams including specialized features, to help you draw your diagrams much faster.
4. Canva Infographic Maker

Canva Infographic Maker, is a simple and easy-to-use online tool for infographs and digital designs, from business cards, flyers, brochures, presentations and other design. Canva also has a vast library of images, icons, fonts and features to choose from if you need help with templates.
Canva library is stocked with hundreds of unique elements you can use to create professional infographics for your marketing material in no time. Many of these elements are free, while premium elements will never be more than $1.
5. Piktochart

PiktoChart is an amazing online software that helps you represent your Information beautifully by Creating Infographics. Three features which I really like about this website are powerful editor, professional design and its very easy to use.
With PiktoChart, you’ll have access to a weekly updated library of over 600 professionally-designed templates. So, finding a style that fits your message is easy.
6. Infogr.am
Using this website you can create Infographics and interactive online charts. One thing you will like about this website is that it’s free and super-easy. Here you can also follow other users and discover amazing data stories!
Using Infogr.am, you can choose from 35+ pre-made charts and 500+ maps to create interactive pie charts, line charts, and bar charts. Or design more complex visuals like word cloud and facts & figures that viewers will love to share.
7. Chartsbin
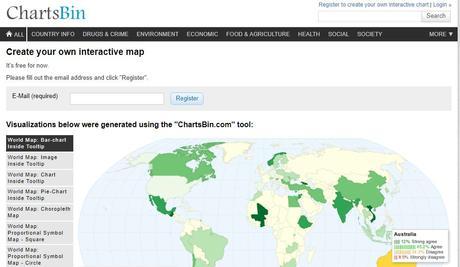
Using ChartBin, you can create interactive maps online instantly! No installation required. No coding needed, to get your map designed and shared. You can embed the maps you create in your own website or blog with a few click or copy and paste HTML.
Also export the map as an image to use for other projects without loosing the style.
8. Easel.ly
Use Easel.ly to create your visual ideas, basically Vhemes are visual themes. Drag and drop a vheme onto your canvas for easy creation of your visual idea!
At Easel.ly, you will find 1000s of Reporting, Timeline, Resume and Process templates to choose from and create your infographics. With over 4,000,000 infographics created so far, you will be joining a group pf professional designers.
9. Wordle
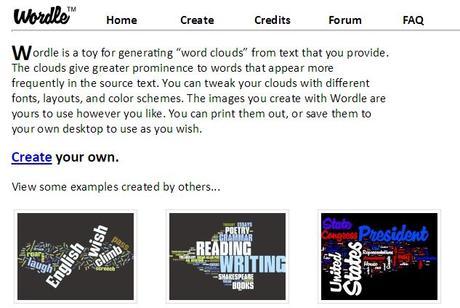
With Wordle, you can create beautiful and fully customizable word clouds Infographs for any use. Simply paste the words you will like to create a visual representation or you can add the url of the particular content and submit it to create visuals of the words. After creating your infograph, you can also publish it on the web.
Wordle clouds give greater prominence to words that appear more frequently in the source text. You can tweak your clouds with different fonts, layouts, and color schemes. The images you create with Wordle are yours to use however you like.
10. Google Chart Tool
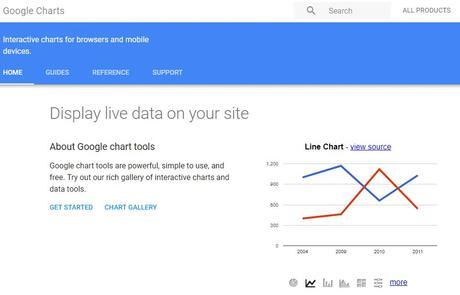
Google chart tools are powerful, simple to use, and free. You will find a rich gallery of interactive charts and data tools to help you create graphs, diagrams, infographics, pie charts and much more!

