Free information about stocks and other investments is certainly more abundant than it was in the 1970’s when I first got interested in the stock market from watching my father at his desk, tracking his stocks. That doesn’t mean that there is more good information than there was at that time. Let’s look at how the tools of stock investing have changed over the years, some for the better, some for the worse. Along the way, I’ll talk about what I’ve found to be useful when selecting which stocks to buy.
Please note that this article contains a lot of tax information since we’re dealing with tax-advantaged accounts. This information is believed to be accurate as of the publishing of this article, but tax laws change all of the time, and there are often a lot of caveats that change the results, so you should consult with a CPA or do a lot of your own research before proceeding. The author of this article is not a CPA. Links to the sources of information presented are included where possible and these references should be consulted and their veracity assessed by the reader.
Tools of my father
I learned to invest from my father in the 1970’s. There were some mutual funds at the time (no index funds), but most people would invest by choosing individual stocks. My father held several individual stocks, several individual corporate bonds, and a few closed-end mutual funds. (These are funds like exchange-traded funds (ETFs) where you trade shares of the fund with other investors, rather than sending your money to the mutual fund companies and receiving shares based upon the net asset value of the fund. This had the advantage that the fund manager didn’t need to worry about selling shares if a lot of people were redeeming their shares, or put a lot of money to use if a lot of people were buying into the fund.)
I remember seeing him sit at his desk in the corner of our family room with his desk lamp on. He had a four-color ballpoint pen that he would use to make charts of his stocks, by hand, four to a sheet of legal-sized graph paper. He would graph the daily closing price of each of his stocks using the information from the stock tables in The Wall Street Journal. He would also dutifully write the closing price down for each stock on a separate sheet in rows, using one square of his graph paper for each day with the closing prices written along horizontally on the paper for each stock. This would take him perhaps a half hour to an hour per day. As he would finish each sheet, he would start a new one, perhaps keeping the old sheet for a month or two.
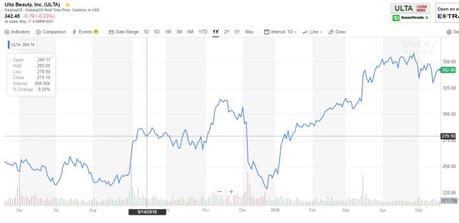
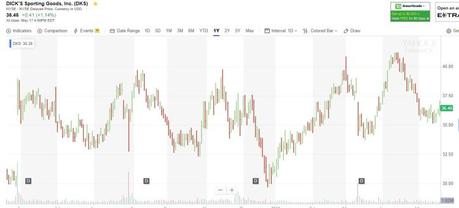
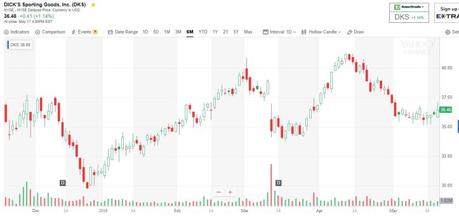
Today his graphs have been replaced with the ability to get a graph for any stock you choose online from various websites. You can not only get graphs of closing date data, as he would do, but Open-High-Low-Close (OHLC) and candlestick graphs as well. You can also easily change the time period of the chart from a day to a week to a month, to a year, and then to several years. You can also plot stocks against each other to see how they have performed relative to each other.

price movements are. Big moves without volume are relatively meaningless.


Value Line Investment Survey
At the age of twelve, I decided that I wanted to take the $250 that I had in my bank account and invest it. When my dad saw that I had an interest in investing, he pulled out another tool that he used, the Value Line Investing Survey. This is a large book which contains one-page evaluations of about 1300 larger stocks. It also has screening tables and proprietary system for screening out stocks. The idea is to use the screening to narrow down your choices to twenty or thirty stocks, then review these companies in detail and select those that you will actually buy.
Value Line is still in use today, although it has both the traditional print edition and online version. You can get a subscription for about $350 per year and it is well worth the price. I have yet to find a source for stock information that is as complete as Value Line. I especially like the long earnings history and projections of 3-5 year stock appreciation potential since I’m looking for stocks with a long history of earnings growth.
Tools from my college days
In the 1990’s, when I was in college, I used a lot of paper. I had a subscription to The Wall Street Journal, which I would read every day, both for their great news coverage and their regular advice on investing. I would also use their stock tables to track my individual stock investments. I also got a copy of Investors’ Business Daily, a competing paper to The Journal.
I would also get a copy of Barrons, which came out weekly. The best thing about Barrons was Alan Abelson’s column, which was always bearish and always funny. There were also in-depth articles about different types of investing, a round-table where investment advisors would provide their picks, and lots of stock data. Except for Alan Abelson, Barrons remains largely unchanged to this day.
Finally, I would get copies of Daily Charts, which were chart books that provided charts for about 500 stocks. I would flip through these chart books and look for stocks with price histories that met certain patterns. I was usually looking for a stock that was going from a downtrend to an uptrend. To learn more about stock trends, check out How to Chart Stocks – Part 3, The Trend is Your Friend. Looking back, I can’t believe the sheer volume of paper I was going through each week.
Today’s Tools
Today the paper charts have been replaced by online charts. I mainly use Yahoo Finance since I like all of the chart options that they have. They also have a fairly extensive collection of financial information. I can’t find historical earnings data, so I still use Value Line Investment Survey. The Wall Street Journal seems to have a lot less information on investing, so I’ve let my subscription lapse. The one thing I definitely miss is a page of bond prices. I have no idea where to get corporate bond information anymore.
I currently have a subscription to Barrons, but find that I’m reading it less and less since I just don’t have the time. Plus, since I’ve been focusing on making long-term investments in quality companies, I really don’t care what investment managers are doing.
Like what you’re reading? Keep the blog going – Refer a friend to the Small Investor.
Follow on Twitter to get news about new articles. @SmallIvy_SI
Disclaimer: This blog is not meant to give financial planning advice, it gives information on a specific investment strategy and picking stocks. It is not a solicitation to buy or sell stocks or any security. Financial planning advice should be sought from a certified financial planner, which the author is not. All investments involve risk and the reader as urged to consider risks carefully and seek the advice of experts if needed before investing.
