Ever wondered why you can see graphs of candidates’ results online but when printed the graphs disappear? This usually happens because of your web browser settings and is easily fixed. Here’s how.
Why does it happen?
The graphs appear in the reports as background images when viewed online. By default, internet browsers have the setting "Print Background Images" turned off to save ink. To help you change this setting, we have developed a quick guide that outlines the steps depending on the internet browser you use.
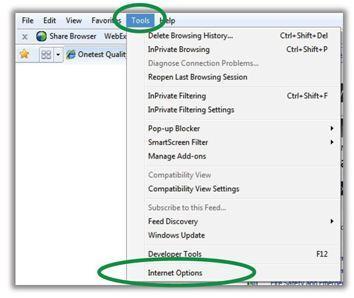
For Internet Explorer users using Versions 6 - 8 follow these steps:1. Click Tools, then Internet Options

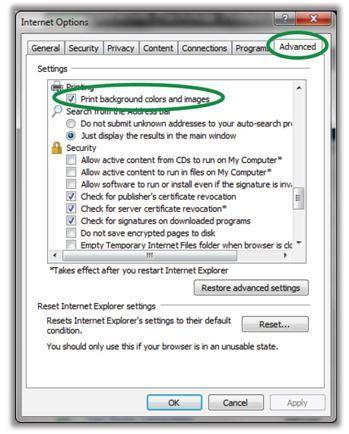
2.Click the Advanced tab and scroll to Printing
3. Check the Print background colours and images checkbox. Click OK

Internet Explorer 8: Complete these additional steps
Internet Explorer 9: Complete the first step only
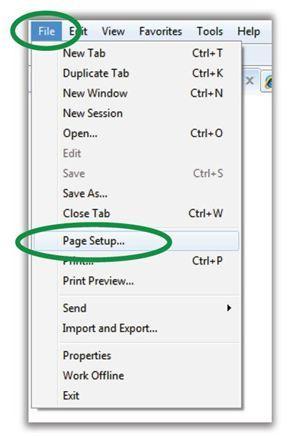
1. Click File, then Page Setup

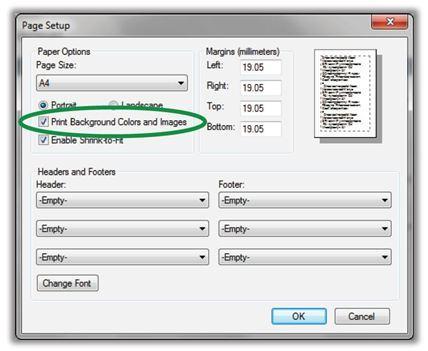
2. Tick the Print background colours and images checkbox
3. Click OK to save changes

For all other Internet Browsers please check out our Onetest Quick guide: Printing Background Images.
If you are unsure what to do or you would like someone to talk you through it, please contact Client Services on 1300 137 937 and we will be happy to assist you.
