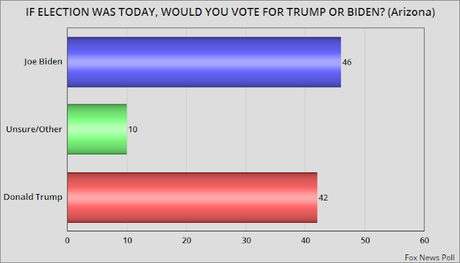
This chart reflects the results of the Fox News Poll -- done between May 30th and June second of 1,002 Arizona voters, with a 3 point margin of error.
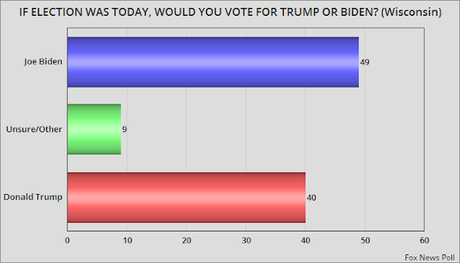
This chart reflects the results of the Fox News Poll -- done between May 30th and June 2nd of 801 Wisconsin voters, with a 3.5 point margin of error.
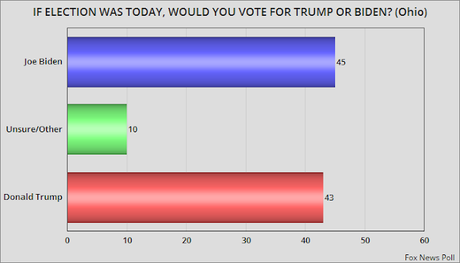
This chart reflects the results of the Fox News Poll -- done between May 30th and June 2nd of 803 Ohio voters, with a 3.5 point margin of error.
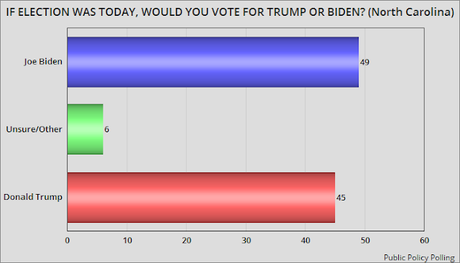
This chart reflects the results of a Public Policy Polling survey -- done on June 2nd and 3rd of 949 North Carolina voters.
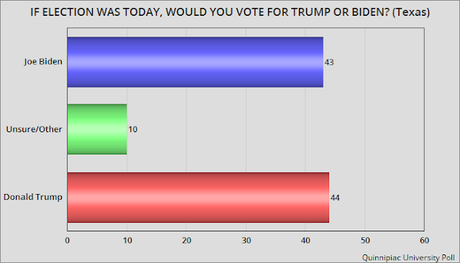
This chart reflects the results of a Quinnipiac University Poll -- done between May 28th and June 1st of 1,166 Texas voters, with a 2.9 point margin of error.
In 2016, Donald Trump carried all five of these states. But polls are showing he could lose all five of them in 2020. He is trailing by 4 points in Arizona, by 9 points in Wisconsin, by 2 points in Ohio, by 4 points in North Carolina, and has only a 1 point advantage in Texas.

