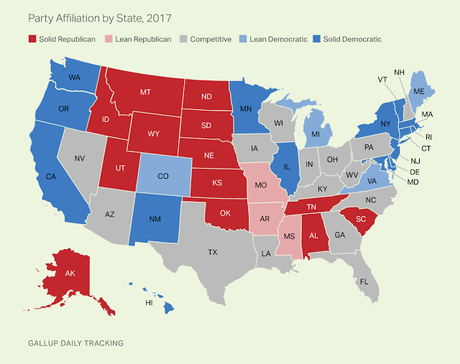

These charts all represent the findings of a recently released Gallup Poll. They questioned 180,106 adults in the 50 states throughout 2017, and their poll has a margin of error of between 3 and 6 points for the individual states.
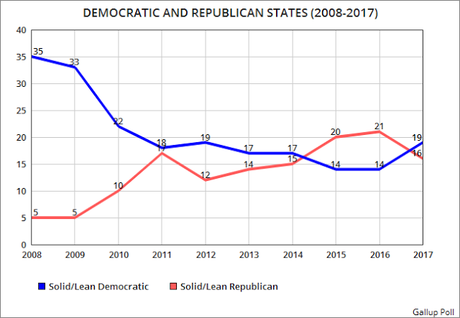
The survey shows the political leanings of the states -- whether they are solidly for one party, lean toward one party, or are competitive between the two major parties. Note that in 2008, the Democrats had a huge advantage -- 35 states were solidly or leaned Democratic, while only 5 states were solidly or leaned Republican.
That started to change in 2009, and by 2011, the Democrats had only an 18 to 17 lead in states. In 2015, the power shifted, with 20 states in the Republican column and only 14 in the Democratic column. That 6 state advantage for Republicans grew to a 7 state advantage in 2016.
But the shift in party loyalty among the states is once again moving to favor the Democrats. In 2017, the Democrats took the lead in states once again (19 to 16). Hopefully, that trend will continue in 2018 -- with more competitive states moving into the Democratic column.
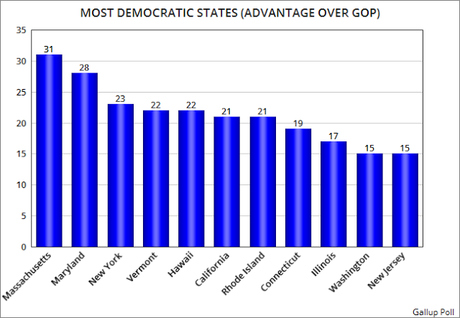
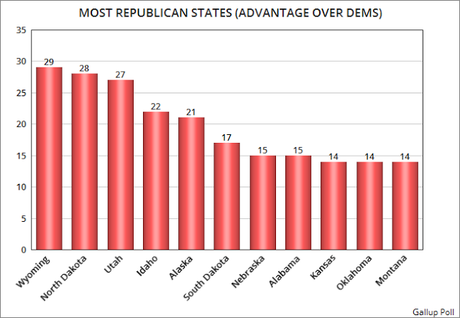
The charts below show the most solidly Democratic and Republican states.


