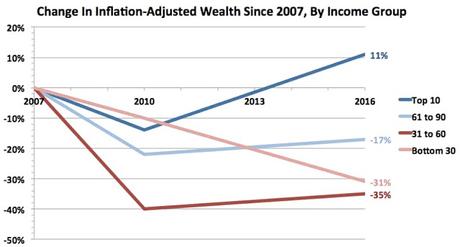
The chart above is from The Washington Post, and uses information from the Federal Reserve. It shows that the top 10% are doing very well. They have actually increased their wealth by 11% over what it was in 2007 (before the Bush recession). The bottom 90% are not doing so well. They remain between 17% and 35% below the wealth they had in 2007 -- meaning they have still not fully recovered from that recession.
And it's not just in wealth. Workers haven't been able to keep up in income either. While the rich have seen their income rise substantially, workers have actually experienced a decline in wages (especially when inflation is considered). Here's how that is described by Robert J. Shapiro in The Washington Post:
As any White House would, the president's economic team touts positive earnings data from the Bureau of Labor Statistics that suggest rising wages and salaries. But the figures are misleading. They focus not on how much an average working person earns but on the "average earnings" of all employed people. In times of rising inequality, employees at the top pull up "average" earnings. Shift to the bureau's earnings data for an average or "median" working person, and most of those claimed gains disappear. Another catch: The data used by the White House doesn't account for inflation. Adjust the median earnings data for inflation, and the illusion of progress evaporates. Let's examine how much these technical sleights of hand distort what's happening to people's earnings. Using the White House's preferred data, average earnings rose from $894.06 in January 2017 to $937.02 in August 2018. That suggests impressive gains of $42.96 weekly over the 20-month period and $30.02 weekly over the past year. But what about median earnings rather than average earnings — that is, earnings of those in the middle of the distribution? The Bureau of Labor Statistics has a different database for that view, and its quarter-by-quarter numbers show a very different picture. Median weekly earnings of all workers rosefrom $865 in the first quarter of 2017 to $876 in the quarter ending June 30, 2018. The typical working American's earnings increased $11 weekly over 18 months, barely more than one-quarter of the economic progress touted by the White House. Even that modest gain is not very meaningful. The significance of what people earn lies in what they can do with their earnings, and inflation eats away at what any of us can purchase or save. As a result, serious earnings analysis is always framed in inflation-adjusted, or "real," terms. From January 2017 to June 2018, inflation totaled 3.77 percent, while the $11 increase in unadjusted weekly earnings over those 18 months represented gains of 1.27 percent. To determine how much the real earnings of a typical working American fell during that period, simply adjust the $876 in median weekly earnings in the quarter ending June 30, 2018, for the 3.32 percent inflation that occurred in the 18 months from the first quarter of 2017 to that date. The result: $876 in June 2018 had the same value as $848.20 in January 2017. In real terms, the weekly earnings of a typical working American fell $16.80, or 1.9 percent, during Donald Trump's first 18 months as president. Another blow to the White House's preferred economic narrative: The current earnings decline is a new development. Using the same measure, real median weekly earnings increased substantially during Barack Obama's final 18 months as president.

