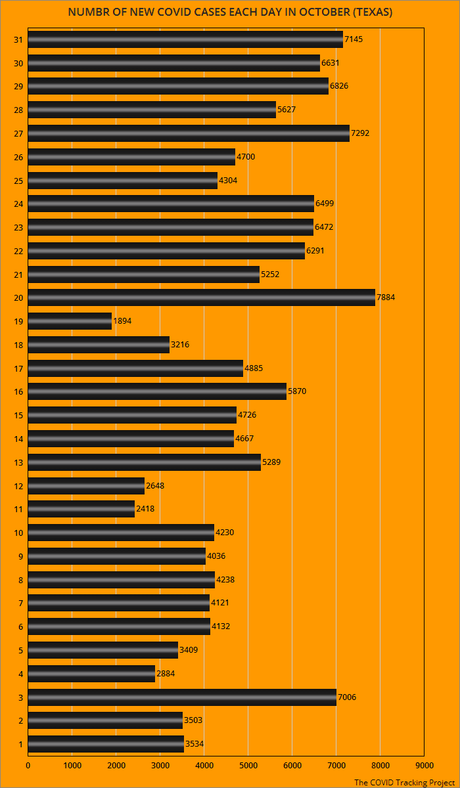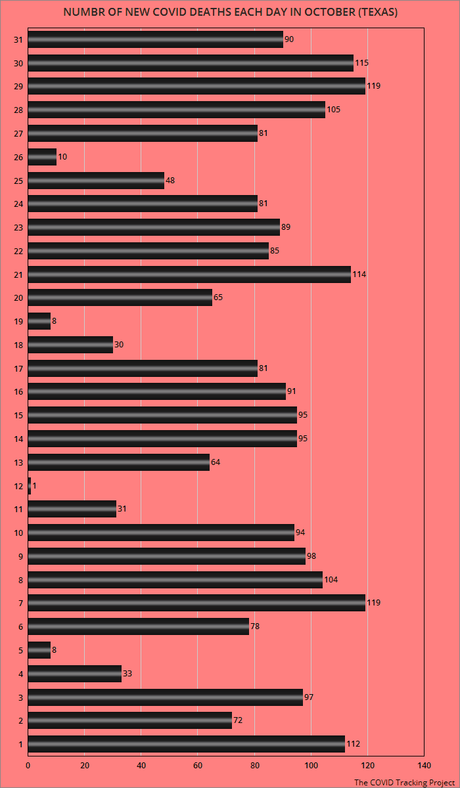

The charts above relate to COVID-19 in Texas. The orange chart shows the daily number of new cases, while the red chart shows the daily number of new deaths due to COVID-19.
For the month of October, Texas had 151,629 new cases (a daily average of 4891.3).
For the month of October, Texas had 2,313 deaths (a daily average of 74.6).

