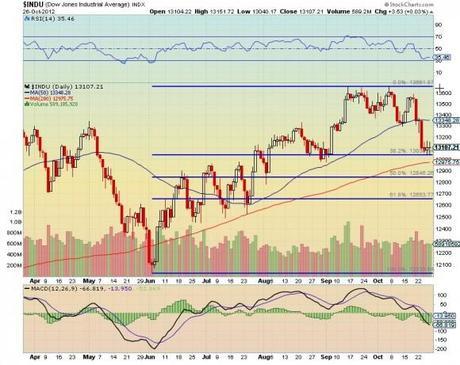
Dow Jones – INDU chart technical analysis 2012.10.27
Fibonacci lines working well as support levels for Dow Jones Industrial Average index. The next main support for $INDU is at 200-days moving average 12975.

Dow Jones – INDU chart technical analysis 2012.10.27