The stock market analog has delivered a solid market forecast over the past few weeks and we are below the 50 period moving average on the bollinger band trade that was previously identified. Starting tomorrow, I am going to be out for the next 4 weeks, so thought I would do this post today given the extreme break of the middle of the chart. Over the next 4 weeks, I will still be doing short term trades where I can, but will not have time to post blog posts.
Here is the stock market analog I am following for the next 4 weeks unless the market takes it out: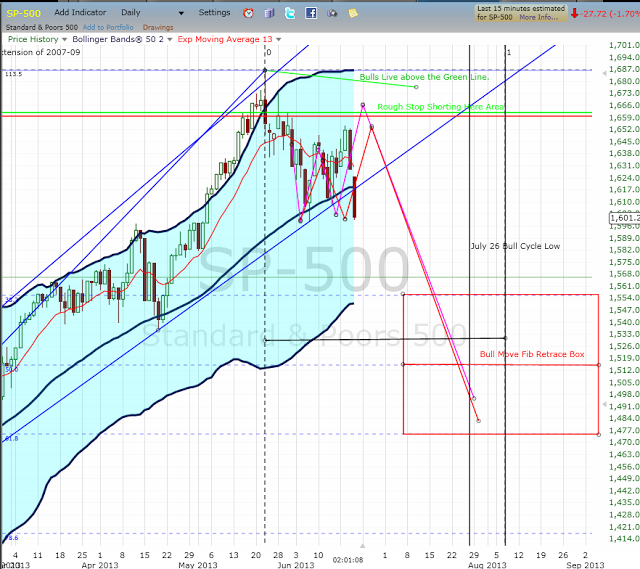 The stop on the analog is still the "rough stop shorting area" on the chart, which has not changed in weeks. The analog is more time than price, and may be more bearish, or less bearish (e.g., SPX 1515ish) than evidence on the chart. If I were around over the next month I could refine targets as we go. Good luck!
YESTERDAY'S CONFIRMATION
The B wave top came within 4 points of the harmonic target, which was 1659. Harmonic Top Post.
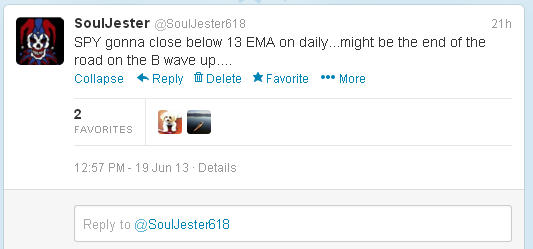
To be safe, I used the 13 ema on the daily, which was why I was discussing it yesterday. Yesterday's Post. Here are the charts from Wednesday:
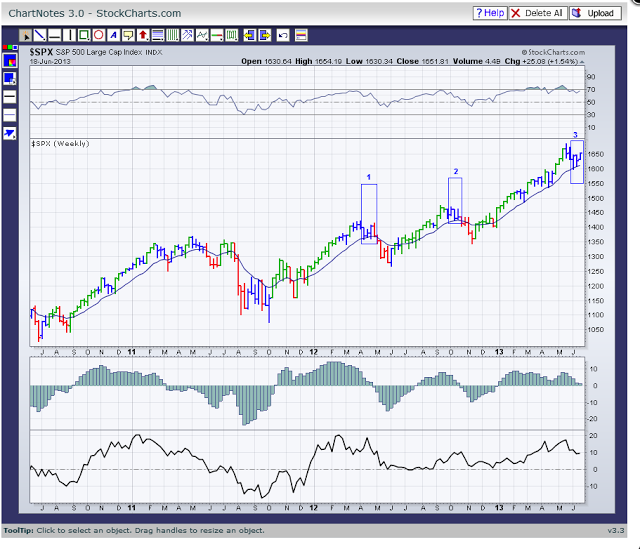
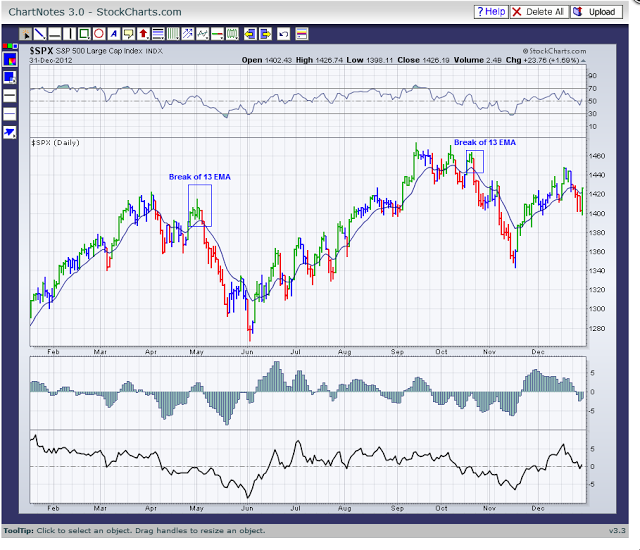 Here is the chart from last night where we broke the 13 ema on teh daily.
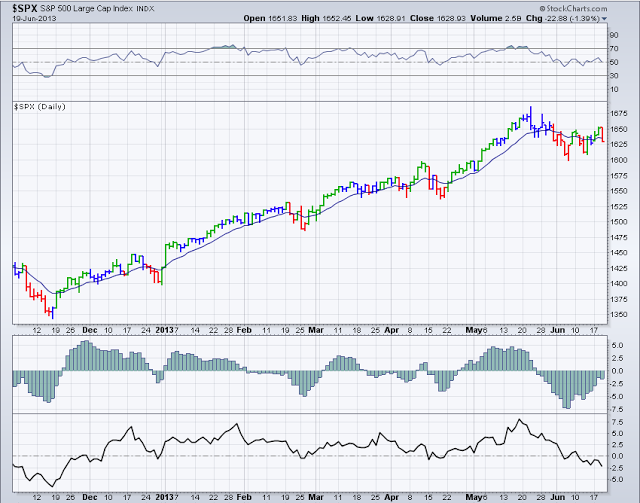 Yesterday into the close it became apparent the 13 EMA was going to fall and the B wave was likely over.
 PRIOR ANALOG POSTS
To follow the development of this shorter term thesis analog, see the prior posts as I went forward and despite not fully trusting it traded with it. June 18 Stock Market Update; June 17 Stock Market Update; June 13 Stock Market Update; June 11 Stock Market Update; and June 9 Stock Market Update.
This is why as part of my stock market updates, forecasts, and outlooks I employ analogs. They keep me on the path. I don't make them up. They are derived form intense indicator analysis which is both objective and subjective in its formulation. Using this method I created, is how in 2012 RLS nailed and predicted the June 4 low and all subsequent moves in both directions going 11 out of 11 into completion. Original 2012 RLS post: RLS POST from May 2012; and Final RLS Post: Perfect 11 out of 11. In addition, RLS Analogs also called the September 2013 price high, and identified the November low period.
The key is to use them as road maps and if the market ceases following the map, then you deviate and look for a new map. If the market follows it, I follow it until it is taken away. In my opinion, this is unbiased trading and prevents the loss that the ego guessers and rapid monkey traders on the blogs incur by over trading. Nobody knows the future. Only the sands of time know which potential scenario the market will choose. Staying present with a map is the key for me. That is why I do not make stock market "predictions" and instead employ scenarios. Predictions are human ego, which lies and decieves.
SINCE THE MAY 22 TOPOn May 22 I was looking for evidence of a top being put in, Final Thrust Post, and Mid Day on May 22, the Market Broke Key Lines and we went with it.
Since that May 22 top, I have been trading short term Wonderwood Positions in both directions around the larger thesis. So far since the May 22 top (excluding the one remaining current long position) I have gone 7 out of 10 with that 10 point stop this week pre Fed. Pre Fed Stop.; Recent Summary 1. All stops have been less than 10 points and the trades were reentered shortly thereafter and were correct. I have not been leaning the wrong way at all since the top. The total SPY points (excluding the current position) from these short term positions is now (approximately 14.63 SPY Points/146.63 SPX points since the May 22 breakdown) trading in both directions. See also Prior Recent Summary 2.
THE LONGER TERM THESIS
This is all consistent with the long term thesis. To track the longer term thesis, which is playing a back test of the November 2012 low, please review: May 4 Long Term Thesis Update; June 9, 2012 Link Regarding Long Term Thesis; and May 7 Long Term Thesis Update;and May 22 Is a Hard Rain Gonna Fall?
OTHER SETUPS AND TRADES
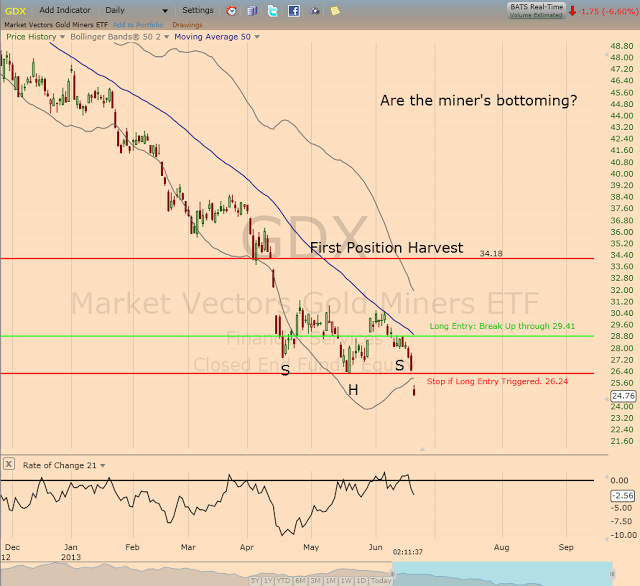
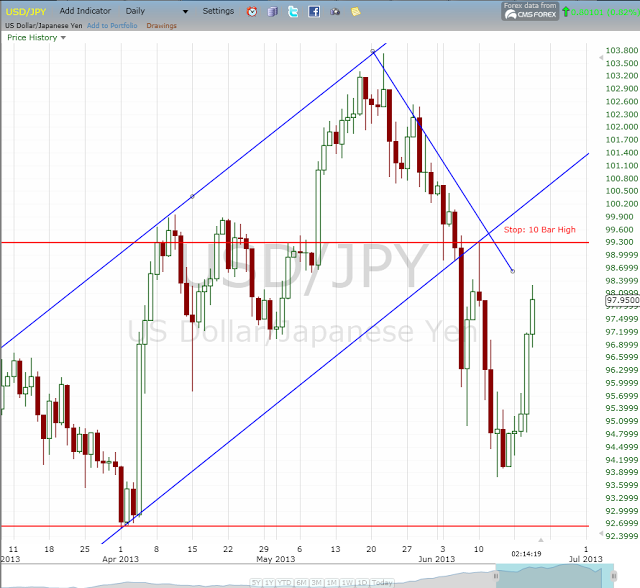
The recent attempt at NZDUSD was stopped out. The GDX setup has not yet triggered, though this move is way outside the daily bollinger bands. I still like this trade and am waiting for a confirmed breakout. Recent GDX Post. Here is the chart:
Peace, Om,
SoulJester
