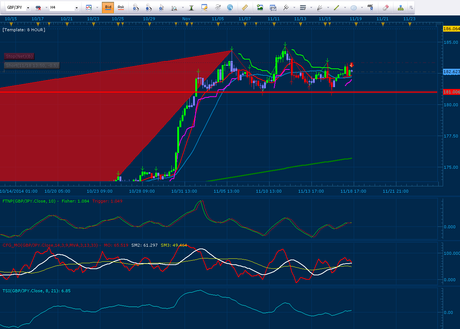
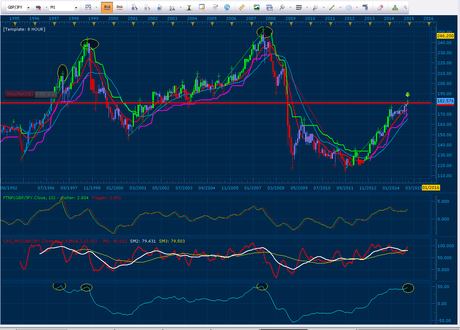
 This pair is interesting because one of my monthly indicators is at the same level it was in 1998, 2000, and 2007. Chart:
 Now, I am not saying the result will or will not be the same. For me to change back to the alternate long term bear primary I would need to see some things confirm the bearish analog that I have been ignoring so far. The reason it is of interest is the long term cycle peak (under the bearish scenarios) which I showed in Today's Equity Post.
There is always a bull path and a bear path. We cannot know which path our future will choose. As always, do your own due diligence, read the Disclaimer, and make your own investment decisions.
Peace, Om,
SoulJester
