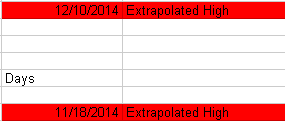
I previously ran some rough cycles which gave me potential near term cycle highs of November 18 and December 10.
 Analog cycles are not usually exact. This has implications for equities potentially, which is why on November 18, I asked the question Could the stock market top here?
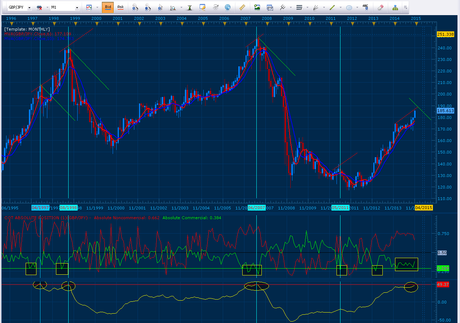
Here is an update on the analysis of the yen reversal thesis. We are nearing extreme indicator and sentiment readings on the monthly GBPJPY chart. These extreme conditions have led to significant down drafts historically. There is some indicator room left, which is why I am still stalking this long term trade. Chart:
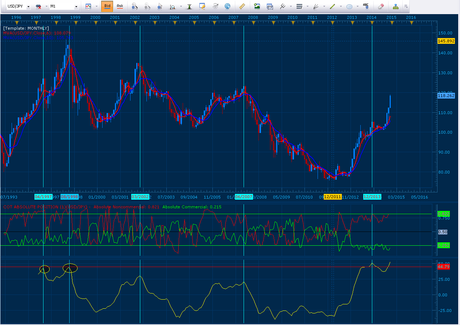
 Now, on USDJPY we seem a similar extreme indicator and sentiment condition.
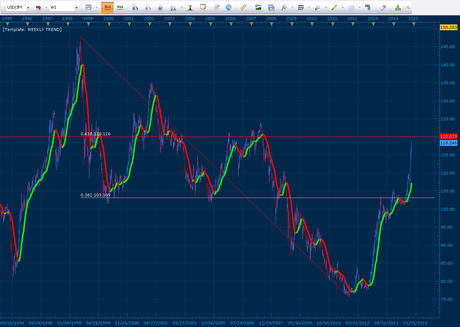
 As for resistance, we do have significant fib resistance on USDJPY coming in right at the 120 level, which is the 61.8 retrace of the 1998-2012 down wave. The prior fib resistance of this wave at the 38.2 level did provide resistance on the way up. This area and the next couple weeks are very ripe for a yen reversal.Chart:
 As for its impact on equities, I will do another post on that as the data comes in. Presently, we still have a bullish intermediate trend (see indicator to the right), but I am being cautious on equities per my November 18 post. Could the stock market top here? For both this yen play and the equity play, I would like to see some evidence of an intermediate trend change in equities. I will be following this over the next couple weeks.
There is always a bull path and a bear path. We cannot know which path our future will choose. As always, do your own due diligence, read the Disclaimer, and make your own investment decisions.
Peace, Om,
SoulJester
