If you follow my blog regularly, you’ll know that around the middle of each year I publish a list of journals in conservation and ecology ranked according to a multi-index algorithm we developed back in 2016. The rank I release coincides with the release of the Web of Knowledge Impact Factors, various Scopus indices, and the Google Scholar journal ranks.

The reasons we developed a multi-index rank are many (summarised here), but they essentially boil down to the following rationale:
(i) No single existing index is without its own faults; (ii) ranks are only really meaningful when expressed on a relative scale; and (iii) different disciplines have wildly different index values, so generally disciplines aren’t easily compared.
That’s why I made the R code available to anyone wishing to reproduce their own ranked sample of journals. However, given that implementing the R code takes a bit of know-how, I decided to apply my new-found addiction to R Shiny to create (yet another) app.
Welcome to the JournalRankShiny app.
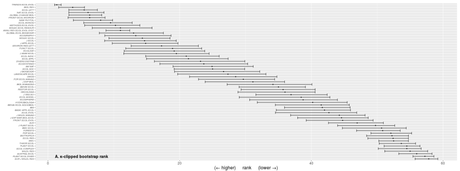
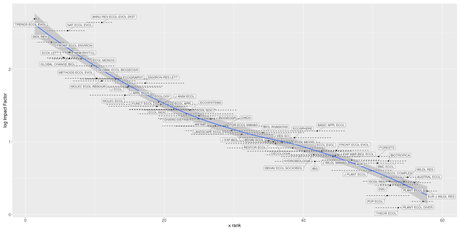
This new app takes a pre-defined list of journals and the required indices, and does the resampled ranking for you based on a few input parameters that you can set. It also provides a few nice graphs for the ranks (and their uncertainties), as well as a plot showing the relationship between the resulting ranks and the journal’s Impact Factor (for comparison).
The only real limitation here is that the user is required to create an input file with the six necessary indices, and five of the six required indices are subscription-based. That said, most universities have access to both the Web of Knowledge indices (Impact Factor and Immediacy Index), as well as the Scopus suite (CiteScore, Source-Normalized Impact per Paper, and SCImago Journal Rank). The last remaining index — the Google 5-year h-index — is open-access.

I use the app all the time now whenever I’m considering a sample of journals to which I am contemplating submitting a manuscript. Typically, this involves fewer than 10 journals, so the task of acquiring the necessary data is not too onerous. Once uploaded (as a .csv, tab-delimited, or space-delimited text file), I can then choose the number of bootstrap iterations (more = more time to run the algorithm), the κ-clipping value (this essentially removes extreme outliers for the calculation of the uncertainty range for each journal’s eventual ranking — if you want to know more about this, read our paper), and the number of times I use the κ-clipping procedure.
Once complete, a table is created ranked by the κ-clipped median ranks, which you can also download. Clicking on the next tab (‘rank plots’) gives you two plots (κ-clipped and normal bootstrap ranks) of the journals ranked from highest to lowest. A third tab (‘Impact Factor vs. rank’) shows the logarithm of the journal’s Impact Factor versus the κ-clipped ranks, and the fourth tab (‘input/output column descriptors’) explains what each input and output table column abbreviation means.

Of course, the entire Shiny code and necessary functions are available also on my Github account.
You can also play with a pre-existing table of journals for which I’ve collated the latest (2019) data that you can use to see how the app works. Just download the file here, and then upload it into the app as described to see how things work. Once you’re comfortable with the interpretation, you can select a subset of those journals, or add new ones, to your heart’s desire.
Have fun, and I hope it helps you appreciate the nuances of journal rankings a little bit better.
CJA Bradshaw

