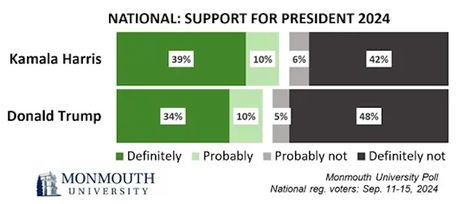
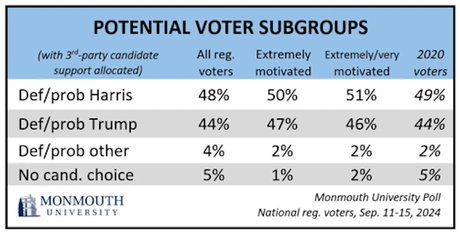
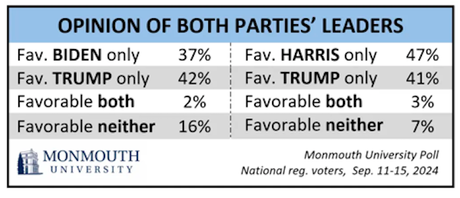
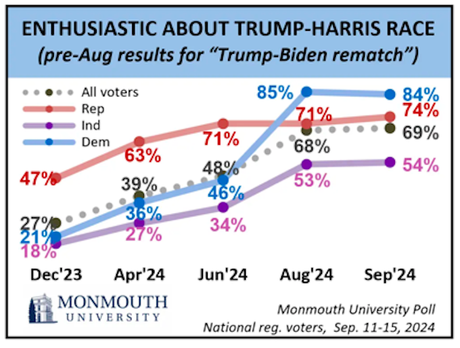
The charts above are from the Monmouth University Poll -- done between September 11th and 15th of a nationwide sample of 803 registered voters, with a 3.9 point margin of error.
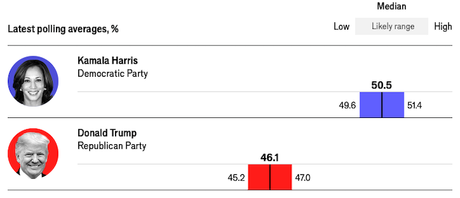
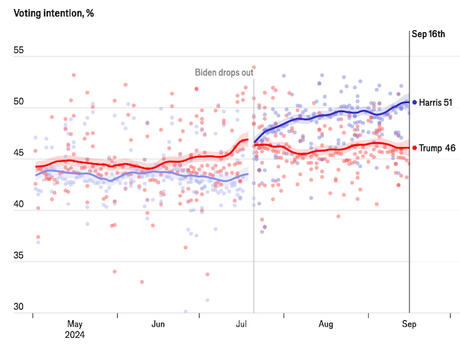
The two charts above show the average of polls by The Economist.
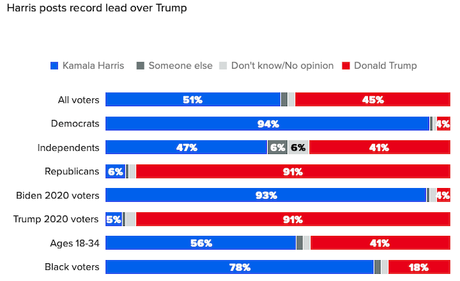
The chart above is from the Morning Consult Poll -- done between September 13th and 15th of a nationwide sample of 11,022 likely voters, with a 1 point margin of error.

