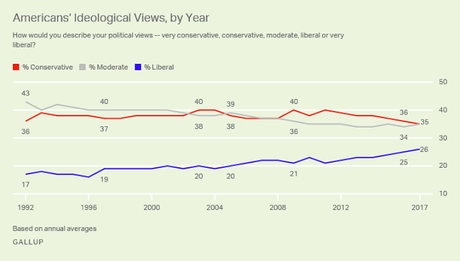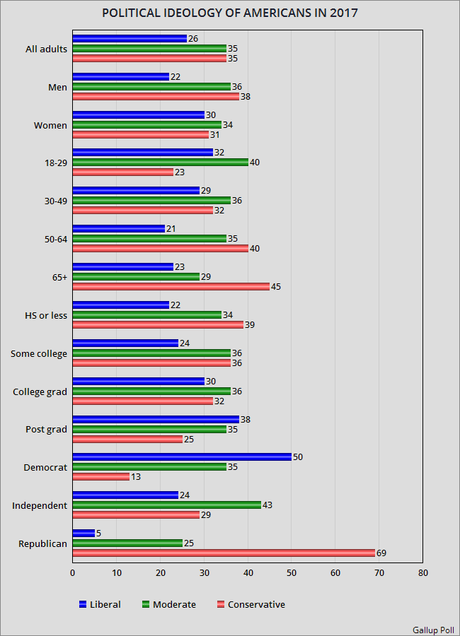
These charts are from the latest Gallup Poll taken on the political ideology of Americans. It was done in 2017 of a random nation sample of 12,766 adults, and has a margin of error of 1 points.
The chart above shows that the percentage who identify as liberal has increased by 5 points since 2010 (from 21% to 26%). Those identifying as conservative has dropped by an equal percentage (from 40% to 35%).
The chart below shows how the members of demographic groups identify themselves. Liberals do best among women, younger people, and those with more education.


