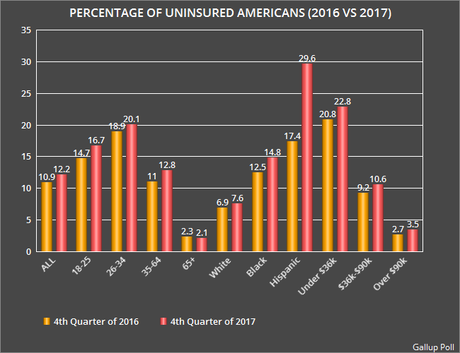
The chart above reflects the numbers in a newly released Gallup Poll. It was done between October 1 and December 31st of 2017 of a random national sample of 25,072 adults, with a margin of error of only 1 point. It compares the number of uninsured Americans in the 4th quarter of 2016 (Obama;s last year in office) with the 4th quarter of 2017 (Trump's first year in office).
Note that the percentage of uninsured Americans has risen since Trump took office by 1.3% (from 10.9% to 12.2%), reversing a trend of several years that had the percentage decreasing. And there was a rise in the percentage of uninsured in every income, racial, and age group but one -- those over 65 who are covered by Medicare (and Trump and the congressional GOP are laying plans to cut Medicare).
That 1.3% may not sound like much, but in a country with a population of over 323 million people, that translates to about 4 million people. That's a lot of people who no longer have any health insurance -- and Trump's policies are just beginning to disrupt the insurance market. I expect there will be millions more who've lost their insurance at this time next year.

