
The Numbers in all of these charts is from The COVID Tracking Project.
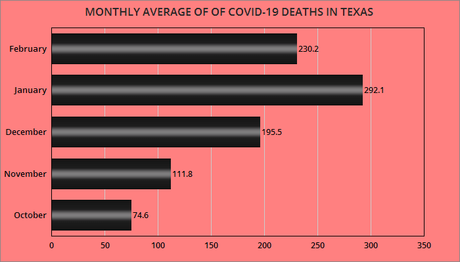
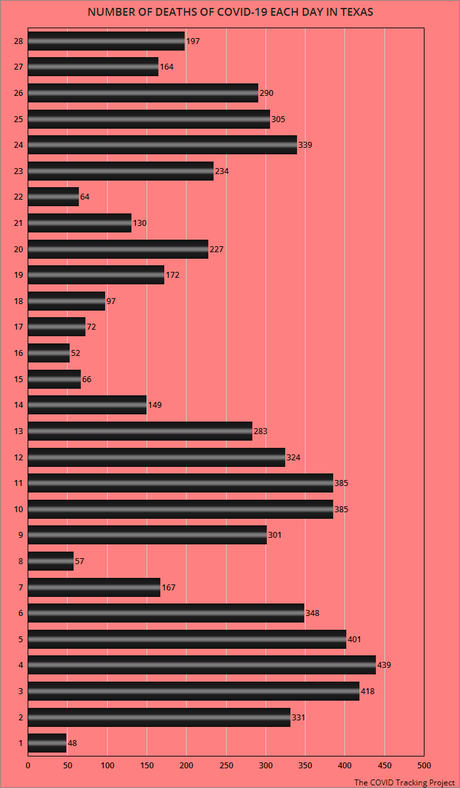
The charts above show the average number of deaths and cases for each day in February for Texas. Note that the deaths dropped in February, but still averaged more than in October, November, and December.
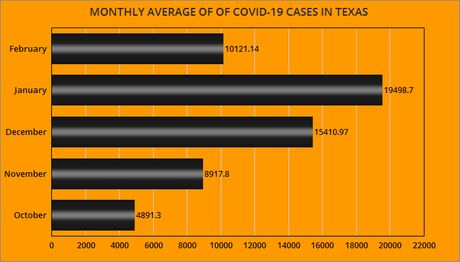
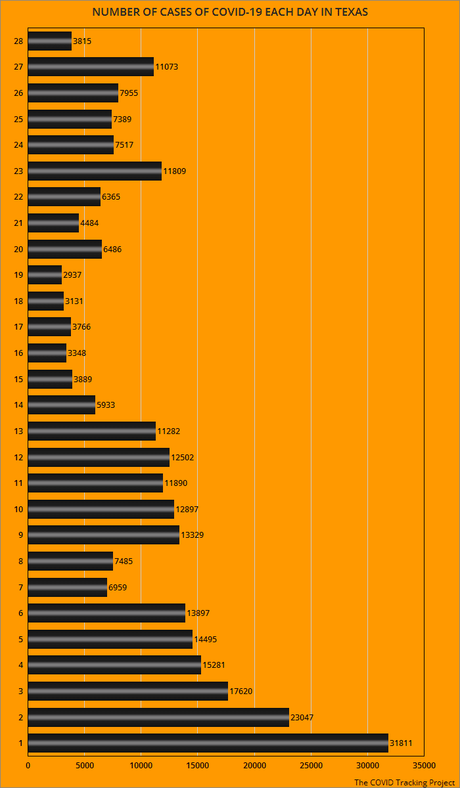
The average number of cases also dropped, but was still larger than in October or November.
It's good that the numbers are finally beginning to fall, but both cases and deaths are still far too many. Hopefully, as more people get vaccinated, we can finally get control of this pandemic.


