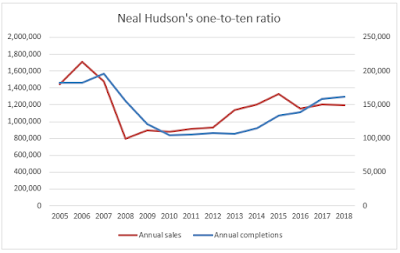
Somebody asked me recently whether this ratio still holds.
The answer appears to be, yes, there is still a ratio but since 2005, it is closer to one-to-eight than one-to-ten. Maybe he was using different data sources? Maybe it's do with Help-to-Sell and all the similar subsidies that Labour introduced post-2008? I used numbers from here and here. If anybody finds transaction numbers for a longer period, please send me the link.
The reason for this is simple. House builders know that if they build more homes, their selling prices would drop and costs would increase. They work on marginal revenue and marginal costs, which are much lower (or higher) than overall average revenue (or costs) and they stay at the narrow sweet spot which maximises marginal profit per unit i.e. by drip-feeding one new home for every seven existing homes that are bought and sold. So anybody who believes that handing out planning permissions like confetti would lead to more construction and lower prices is living in cloud cuckoo land, home builders will always stick to the one-to-eight profit maximising level.
OK, we can argue over cause and effect, but it's clear from the chart that the blue completions line lags (i.e. responds to) the red sales line by about a year. Homebuilders make their decision on how many units to start when sales are high, and this year's completions depend on last year's starts, in extreme situations (like 2008) they just leave things half-finished (or something like that).
This is quite unlike mass-produced goods where average costs go down by much more than selling prices if output is increased, so as far as a manufacturer is concerned, the more the merrier. In 2008, house prices fell by about a fifth and supply fell buy a half to maintain or at least maximise margins.

