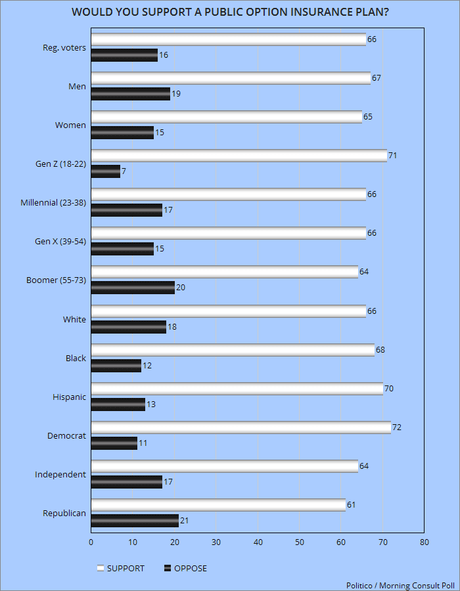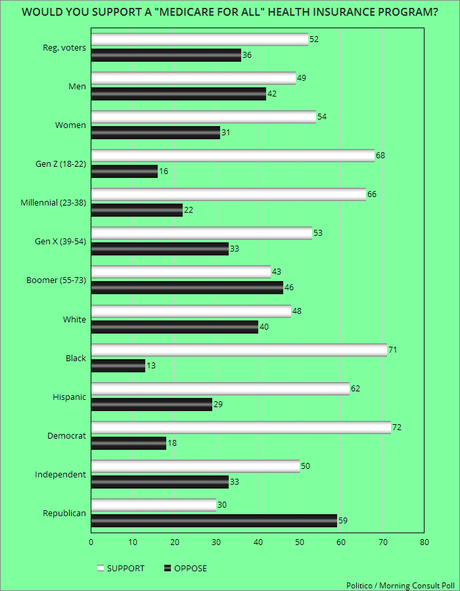

The two charts above reflect the results of the Politico / Morning Consult Poll -- done between November 18th and 21st of a national sample of 1,997 registered voters, with a 2 point margin of error.
The blue chart at the top shows what the voters would think about a public option being created for health insurance (which would give everyone a choice between government and private insurance).
The green chart shows what voters would think about putting everyone into a government insurance program (like "Medicare for All").
Note that while support has grown for a Medicare for All plan, only about half the population would support it. However, there is now overwhelming support for a public option (with even a substantial majority of Republicans supporting it).

