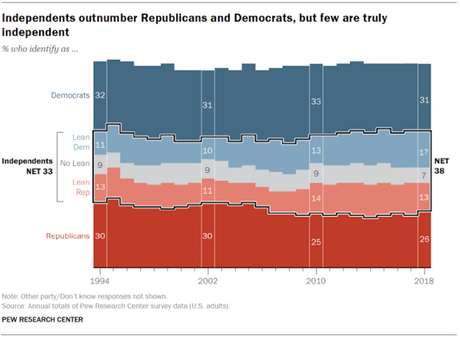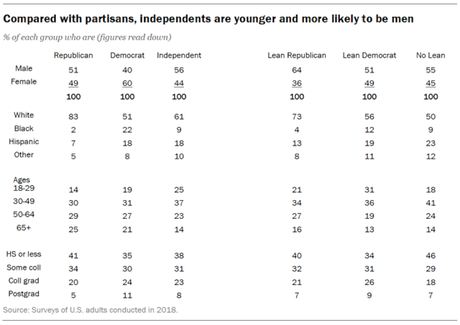

The charts above are from the Pew Research Center. The percentages are figured from all the surveys done in 2018.
As the top chart shows, the largest percentage of people identify themselves as Independents. They make up 38% of the population, while Democrats are 31% and Republicans are 26%. But most of those Independents actually lean toward either the Democratic or Republican Party.
When you consider that, only about 7% of the population are true Independents (who don't lean toward either party). That's down from 9% in 1994. When you count the leaners, Democrats climb to 48% and Republicans to 39%.
Neither of those parties should count on those votes though. While they lean toward the party, that doesn't mean they won't vote against it if they see it as being too extreme (not representing their general views). While those identifying as Democrat or Republican will assuredly vote that way, the leaners need to be convinced.
The second chart shows the percentage in each group by gender, race/ethnicity, age, and education.

