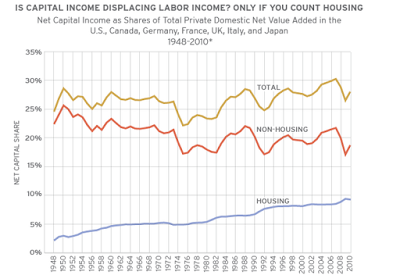
James James refers us to this article about Matthew Rognlie, which contains the following embedded chart:

Although Rognlie is closer to the mark than Picketty He's got the shares going to 'capital' and to 'housing' completely upside down. Let's just look at UK household income not business profits (which is a bit artificial but avoids the need for adjustments for double-counting).
According to HMRC tables 3.6 and 3.7 for 2102-13, total taxable employment and self-employment income was £711 billion and total household income from capital (dividends and interest) was £53 bn. I'll ignore pension income because that is just a confusing mix of taxpayer-funded, deferred employment income, dividends, interest and rent.
The total annual rental value of all residential land is £200 bn. The return on bricks and mortar (the actual capital) is something in the region of £50 bn, which we can add to the £53 bn from above.
So... total income = £1,014 bn.
The percentages are actually as follows:
Employment and self-employment = 70%
Capital = 10%
Land = 20%.
If you want to treat 'housing' as a separate category, the split is:
Employment and self-employment = 70%
Capital = 5%
Housing = 25%
In other words, on average, one-third of tenants' gross earnings goes on rent, which we knew anyway. Rognilie's chart suggests that it is only one-seventh, which is clearly bollocks.
