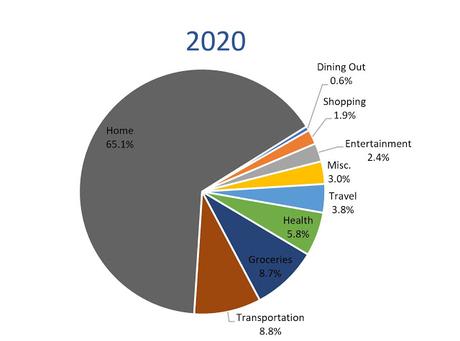
Unfortunately, in 2019 the system that I use for compiling my data had a glitch and I decided not to recreate everything, so I never got 2019 data all put together. This year, I was interested to see how my spending stacked up to prior years, as I did not spend as much money on travel, which is generally my second biggest category. I also wanted to break out some of my shopping a little more fully, and so I spent some time looking through my Amazon, Costco and Walmart receipts since a lot of those are multiple categories, whereas in years past I just called Costco "groceries" and Amazon "shopping."

Overall, in 2020 I spent 94% of my average over the years of 2016-2018, or 6% less than normal. The categories that decreased the most in dollar terms were Travel and Dining Out and the categories that increased the most were Groceries and Health.
Home: (Increase 2% YoY) This category includes mortgage, utilities, garbage, taxes, insurance and garden. As you can see, this is my largest category by far. However, I spent a little more than I normally do in this category, and I chalk that up to the fact that I decided to start paying a little extra toward my principal midway through the year. Otherwise this category dollar-wise has been very consistent through the years and is always my largest.
Groceries: (Increase 62% YoY) Woof! I spent a lot more on groceries than I normally do, which is probably due to the following: (1) I bought a lot of non-perishables online and I probably went a little overboard. (2) I stocked up at Costco a few times. (3) I decided to experiment with making my own dehydrated meals and also tried some new foods for camping trips (that could be its own post!) (4) I cut out sugar and am eating more natural items and I tried a lot of new products for this as well (this could also be its own post). However, an interesting note is that if you add groceries + dining out, I spent less in total this year than I do on average (almost 20% less).
Transportation: (Increase 14% YoY) This category is often my third biggest as it consists of daily public transportation commute costs plus any car related costs like gas, tolls or maintenance. This year, due to COVID, I actually did go into work every day, but I drove instead of taking public transportation, which upped my car related costs significantly. In addition, I had to buy two new tires and a new side window for the Red Rocket in 2020.
Travel: (Decrease 64% YoY) This includes any flights, meals, lodging or activities while traveling. This year I took one flight and paid for one that I did not use. Otherwise, I took a couple of road trips. I tried to be more diligent with breaking down my costs, so this does account for all camping, food, gas etc. that I used while doing the road trips, but there were a lot of cooler and backpack meals and wild camping, so the number was very low.
Misc.: (Decrease 36% YoY) This category is mainly gifts. There are a few credit card fees in there as well, but they are minimal. Normally this includes education, hair cuts and massages, but well...I paid for my education in 2019 and it's still postponed, and there have been no hair cuts this year and I decided to put my one massage in Health instead.
Entertainment: (Increase 10% YoY) This consists of any running, camping, music or national park related items or any other fun activities (excluding travel). This category was larger than normal because of my different allocations this year. In prior years, running shoes were under "shopping" but this year I decided to put them under entertainment. In addition, if I bought food that was only going to be used for camping (a bit of a gray area at times), I categorized it here. The big ticket items were a new tent, two concerts and three pairs of running shoes (I always buy them if they are on sale).
Health: (Increase 69% YoY) This consists of gym membership, health insurance, doctors visits and things like vitamins and protein powder. This year my insurance increased a little, and I also spent some money trying to figure out a pain I had in my foot at the beginning of the year. However, I did finally cancel the gym membership that I was paying for every money but not using!
Shopping: (Decrease 29% YoY) This category was mostly toiletries, home supplies and kitchen gadgets, with the bulk of the total going towards a new Ninja. Actually my second largest subcategory here was pet supplies. Gato had fleas a few years ago and I have happily spent money on flea treatment and prevention since then. Fleas give me nightmares.
Dining Out: (Decrease 90% YoY) Most of my dining out is covered in travel. In fact, I only dined out a few times in January and February when I had some friends visit and we went for beers etc. Otherwise, I bought burritos for my two office mates mid-COVID but that is it!
The Verdict?: I am now an expert at online shopping. I know where to find a good sugar-free jerky and that MRIs and pet supplies are expensive. Reading and weeding are both free. Owning a house is not. I wonder if next year's grocery number will be lower because I will still be working my way through all of the beef sticks and protein powders that I bought this year.
Did you spend more or less in 2020 than you normally do? Which categories do you think differed the most year over year?
