

I think we can now dismiss the idea by some that the 2018 election was not a wave election. The numbers show clearly that the predicted "blue wave" did happen.
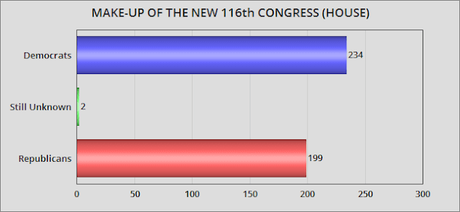
The Democrats did flip the House, and actually exceeded the predictions of most pundits. They currently hold 234 seats in the new House to only 199 seats for the Republicans (with two seats yet to be decided). And this was not done by gerrymandering, but by the votes of the people.
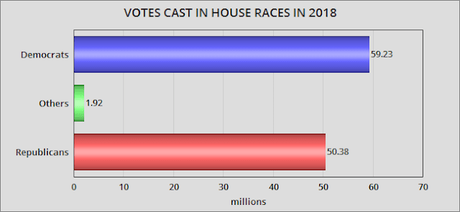
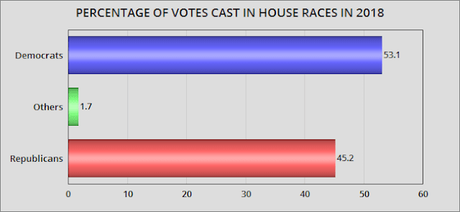
Democrats got 59.23 million votes. Republicans got 50.38 million. That means about 9 million more Americans voted for Democrats than voted for Republicans. Democrats got 53.1% of the popular vote, while Republicans got 45.2% -- a margin of 7.9 points (much larger than the 2.1 point margin that Clinton had over Trump in 2016).
Numbers above are from the 2018 House Popular Vote Tracker.

