Today, the S&P 500 is working on a bearish weekly candlestick pattern that has potential to mark a very important top in the market and will be confirmed by a close below that blue line (edit: which occurred). Here is the chart:
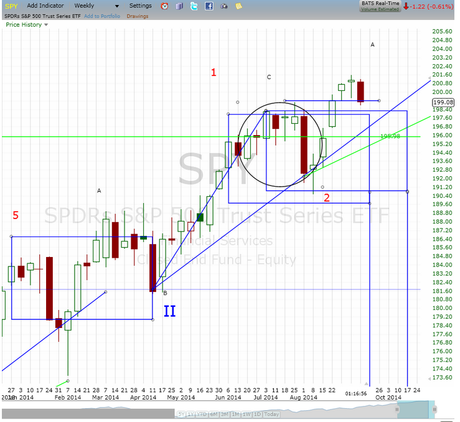 Original 2014 Bear Setup
The original bear scenario that I identified had us potentially doing one more wave up after a July correction, which came at the August rather than September low:
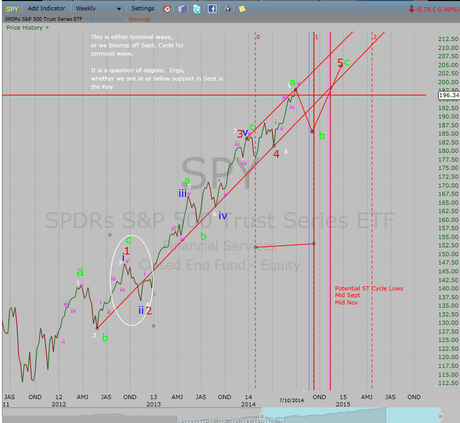
That one more wave up has now occurred in US Indexes. Currently, we also have been carrying a breakdown in the indexes for both Belgium and Germany through the summer:
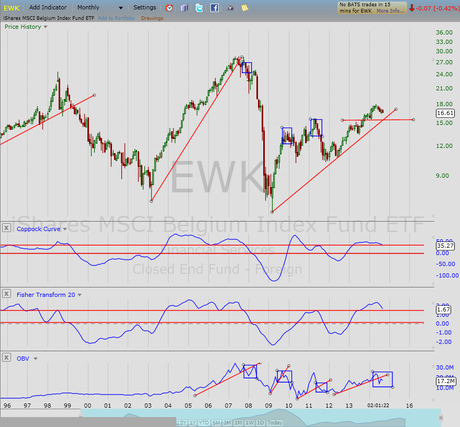
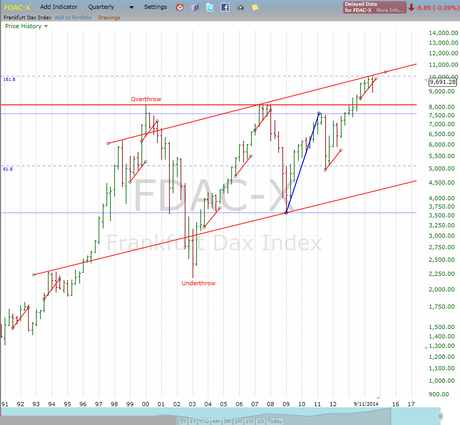
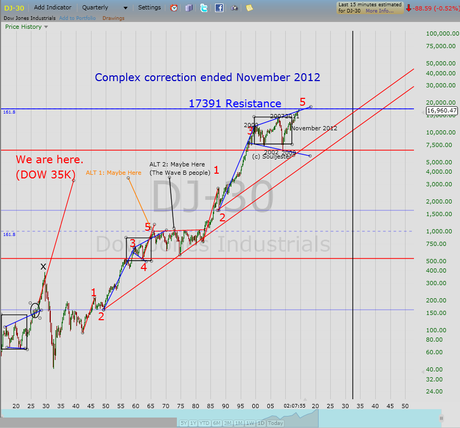
Accordingly, this could very well mark a very important top in the US Indexes. Now, if you have been reading, I have been carrying both a long term bull and bear scenario. As long as the 9 month support base in small cap stocks holds we have to honor the bull and watch support as no US index has broken down yet. Chart:
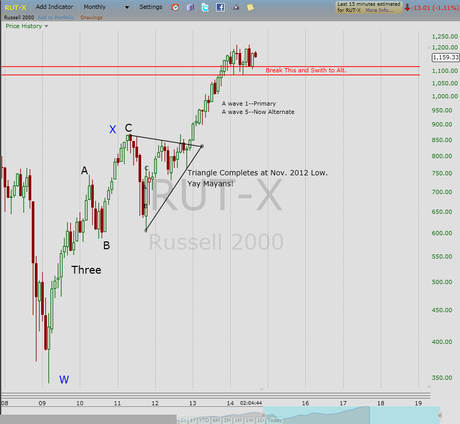
Here is the longer term chart:
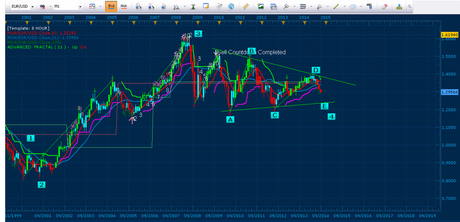
I am also currently tracking a bullish EURUSD setup for this week. Though it is unrelated to this overall analysis, it gives a potential cycle date of March 2015. I will hone in on cycles if this breaks using stronger means. But, for now, I am anticipating that if this does break bear the first significant cycle low would be in Spring 2015.
Here is the longer term view from last week:
Here was the EURUSD BOUNCE LEVEL level identified last week:
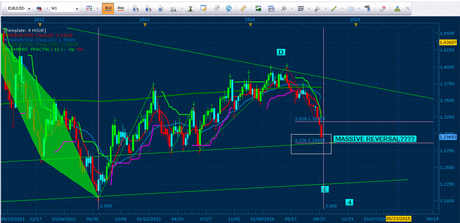
As you can see from the current chart, the EURUSD bounce came with an exact hit this week on the support confluence:
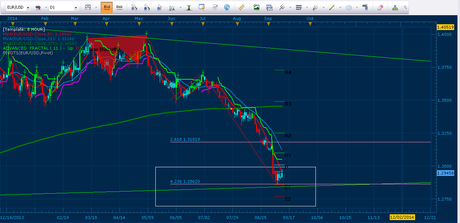
The import of this is that there is a potential currency reversal level of significance that hit this week. I am very bullish EURUSD off this level.
I will continue to personally track this as a longer term equity bull until support breaks. I will not switch to longer term bear until we get a break down, but the significant potential is here given the chart evidence.
SHORT TERM ANALOGS From a short term perspective, here are the bullish analogs I am following (chart from yesterday):
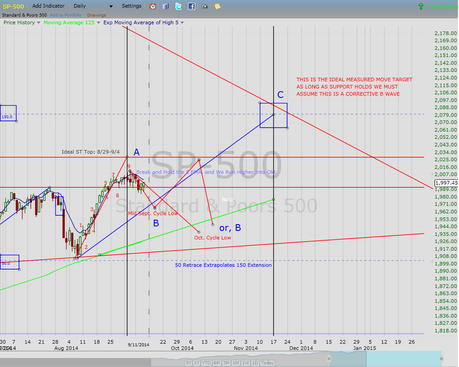
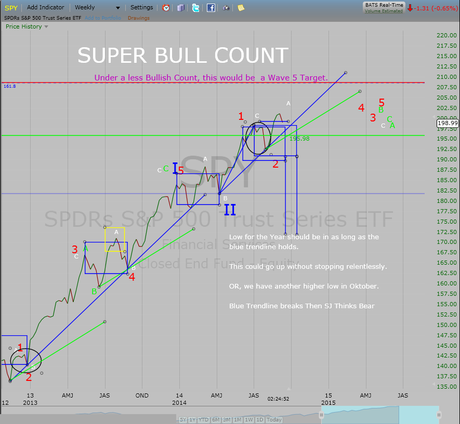
As you can see from the above two charts, the Bullish analogs also have us in a downdraft here. What the Bears need to see on these shorter term analogs is for the support lines to break. It remains long and intermediate term bullish if those lines hold into the fall.
THE KEY--THE FIRST CONFIRMATION OF THE TOP
As you can see from the first analog, I am using the daily SPX 125 SMA as the support line for the bullish analogs. That support delivered in August. That line has held going back to the move off the 2012 low. Today, it sits at 1927.42 and is rising. That was the line I needed to see hold for the move back up off the wave down from the July top. That support held and delivered in August.
Here was a discussion I had with a nice fellow named Katzo coming into that early August low:

THIS IS IMPORTANT. Accordingly, any siginficant move below the Daily S&P 500 125 Simple Moving Average should be treated as the end of the entire bull move up off the 2012 lows. That is the line in the sand. The bullish analogs in the preceding section also show that level to be the case as they go down and test that support into the fall in order to remain viable.
Here is an example from 1987 (the 125 SMA is the blue line on the chart) that I was discussing with Chartrambler a couple weeks ago:
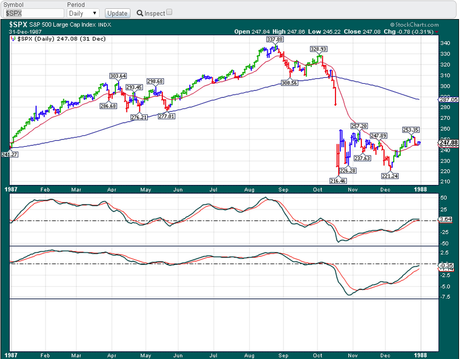
You can see the failure. I am not using a 1987 analog or suggesting one. I am merely showing an example of a failure at support. I suspect that if this is a top the ensuing bearish correction would be of longer duration and more fierce than the 1987 drop.
INDICATOR STUDY
The Analogs have some confirmation in an indicator study I did and posted on another blog over the past few weeks. Here is the study:
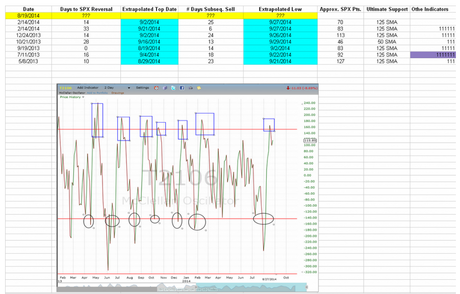
As you can see, the indicator studies (which are taken only from the most recent bull wave from 2012) show an early September high, and a very high likelihood that we will hit the 125 SMA before October is over.
Thus, the question now becomes, will we break the daily 125 SMA and give us the first breakdown support to suggest that the bull wave has ended?
This level is important because the bullish analogs also say we will hit that SMA level. If the top is in, the bullish analogs will fail to hold that level, disappear, and we are bearish with a long term top having occurred on September 4.
SUMMARY AND DISCLAIMER REMINDERThat is the gist of it. There is always a bull path and a bear path. As always, do your own due diligence, read the disclaimer, and make your own investment decisions. Peace, Om, SoulJester
