%%bloglink%%
Since the Dow Jones Industrial Average set a new record, I’ve had several friends and customers ask me “Is it safe to invest now?” and “Should I sell now since the stock market is at all time highs?”
My answer is usually “Not everything is at an all time high.”
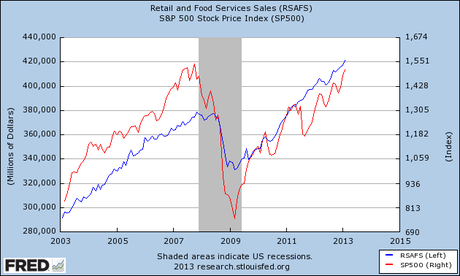
This chart shows the S&P 500 Stock Index (red line, right side) and Total Retail and Food Service Sales (blue line, left side). Retail and Food Sales is and has been for almost two years setting new record highs and the S&P 500 Stock Index is knocking on its previous record.
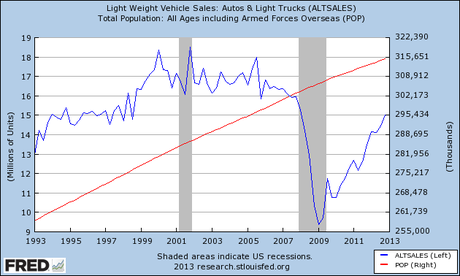
This chart shows Light Weight Vehicle Sales (blue line, left side) and Total Population (red line, right side). Car and truck sales are up dramatically from the lows of 2009 but even after three years of growth, they still haven’t set new records even though there are 28 million more people now than the previous peak car sales of 2002.
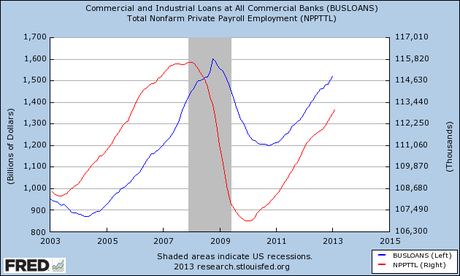
This chart shows Commercial and Industrial Loans (blue line, left side) and Total Private Employment (red line, right side).
Neither Commercial and Industrial Loans (which are typically loans made to small and medium sized companies) nor Private Employment has set new “all time highs”.
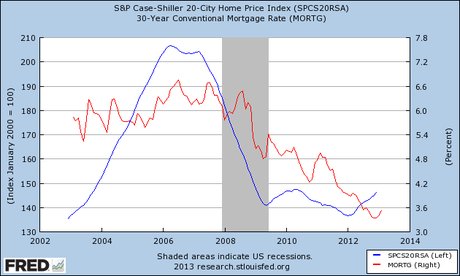
This chart shows the S&P Case-Shiller Home Price Index (blue line, left side) and 30 Year Mortgage rates (red line, right side). Home prices are, on average, nowhere close to their previous “all time highs”.
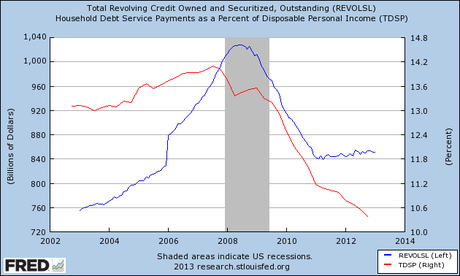
This chart shows Total Revolving Credit, i.e. credit card balances (blue line, left side) and Household Debt Service Payments as a Percent of Disposable Income (red line, right side). Even though Retail Sales has been setting new all time highs for the past two years, it seems consumers have resisted the urge to load up on credit cards.
Yes, some economic yardsticks such as the Dow Jones Industrial Average and Total Retail and Food Sales are at “all time highs” but I’m not concerned about a potential economic free fall because so many other indicators such as: Private Payrolls, Car and Truck Sales, Home Prices, Credit Card Debt, and Debt Burden are reporting an economy that is steadily improving and furthermore many of these data points are at levels far below where they were when the “bubble popped”.
