%%bloglink%%
My wife and I were trying to decide between two Caribbean islands for our vacation: Aruba or Jamaica.
Aruba Jamaica
Average annual temperature 82F 81F
Average high temperature 89F 88F
Average low temperature 78F 72F
Both islands have similar temperate ranges and both have very nice beaches.


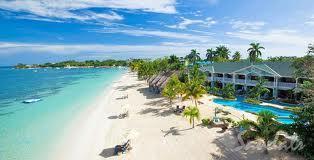
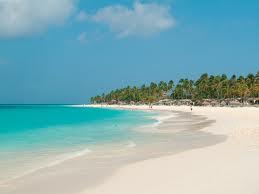
The top picture is from Negril, Jamaica and the bottom picture is from the Divi Resort in Aruba.
The major differences between these two islands come with the joys and troubles that the rain brings.
There are been 20 major hurricanes to hit Jamaica during the last 50 years vs. the last hurricane to hit Aruba was 59 years ago and there were only four others since 1877.
Average annual rainfall in Jamaica is 31.9 inches vs. Aruba’s 16.1 inches.


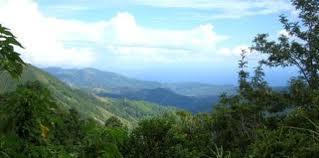
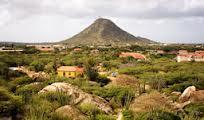
The picture on the top is of the Blue Mountain region of Jamaica and the picture on the bottom is typical of the desert landscape of Aruba.
Yes, Jamaica experiences more hurricanes and rainfall than Aruba but all that rain has allowed lush forest, colorful flowers and several rivers to flourish. Whereas Aruba’s interior is mostly low brush, rocks and cactus.
It doesn’t matter if you’re trying to decide between how to invest or where to go on vacation, you will face the dilemma of choosing between volatility and stability. Both have their advantages and limitations and both can be appealing at different stages in our finances and at different times in the economy.
Here is how stability (Barclays Aggregate Bond Index) has compared to volatility (S&P 500 Index) over the past twenty years. 02/28/1993 – 02/28/2013
Average Annual Return
S&P 500 8.44%
Barclays Bond Index 6.14%
Number of down years
S&P 500 4 (2000 -9.11%, 2001 -11.88%, 2002 -22.10%, 2008 -37.00%)
Barclays Bond Index 2 (1994 -2.92%, 1999 -0.82%)
You can’t have lush, tropical trees and flowers without occasional rain.
sources: Morningstar. Island Visitors Bureaus.
