
English: A student presentation at the International Environmental Design Contest (Photo credit: Wikipedia)

English: Red Pinterest logo (Photo credit: Wikipedia)
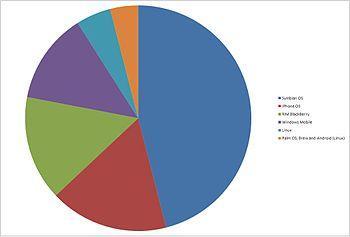
Market share of mobile os s 2008 (Photo credit: Wikipedia)
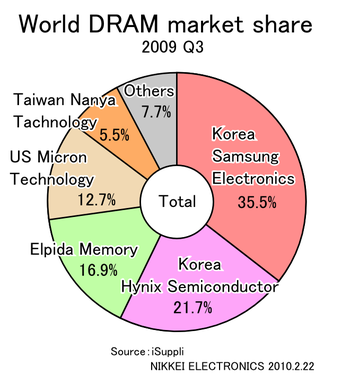
English: World DRAM market share by salesout 2009/Q3 (Photo credit: Wikipedia)
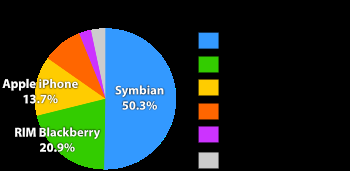
English: Graph depicting smartphone market share in Q2 2009 (Photo credit: Wikipedia)
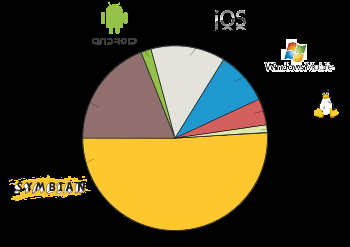
English: Share of 2009 Q2 smartphone sales to end users by operating system, according to Gartner (Photo credit: Wikipedia)
You have 3 deliverables that require completing the following templates: An Oral Presentation, A Written Project and an Industry Analysis Table.
Here are your Project Templates:
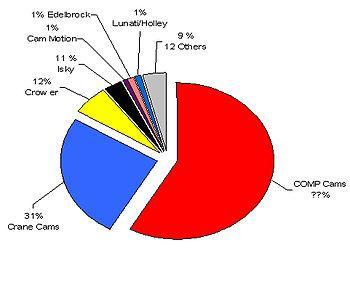
North American Valve Train Market Share (Photo credit: Wikipedia)
I. ORAL PRESENTATION for your company report:
A. Mission statement/objectives/specific strategies.
B. SIC number — industry involvement (describe what #’s mean).
C. History — what they do, sell, or manufacture – How did they begin?
D. Sales and Profits – Three year comparative charts
E. Who owns and/or runs the company – (Executives and Board Members) F. Organization chart showing operating units
G. Stock Performance (52 week high/low) and 5 year trends vs. competitors.
H. Consumer Brands
I. Update/Current Events (see journal report)
J. Global Competitors Written paper should be 7-10 typewritten pages plus computer generated graphs and bibliography.
USE DATABASES IN LEWIS LIBRARY UNDER ACADEMICS FOR YOUR RESEARCH AS WELL AS THE COMPANY WEBSITE AND ANNUAL REPORT INCLUDING THE 10K.
Copy and Paste the following templates into a Google Drive Document
II. Contents of Written Report for Google Drive
I. History:
A. When did the company begin?
B. Who was the founding father?
C. What do they do, sell, or manufacture?
II. Strategic Management Process
A. Mission Statement
B. Objectives
C. Specific Strategies
III. SIC numbers/ NAICS numbers
Describe what each number means and classify using common prefixes.
IV. International Competitive Arena – Market Share Pie Graph (THESE GRAPHS MUST BE DONE ON A COMPUTER USING A GRAPHICS PROGRAM. THE BUSINESS COMPUTER LAB IS AVAILABLE FOR THIS PURPOSE).
V. Operations: List domestic and foreign sites.
VI. Sales and Profits: Three year comparative charts
VII. Organization Chart
A. Operating units with revenue numbers
B. Executives: names and short bio
VIII. Stock Performance:
A. Trend analysis begins the week of Aubust 27, 2014 and ends the day of your oral presentation. Include the graph in your written report.
B. 52 week high/low to 5 year spread or “Max” Spread with global competitors. You can generate this graph on Yahoo Finance.
IX. Consumer Brands (MAKE A VISUAL DISPLAY) You can find pictures on the company’s website.
X. Update: Use journal format to describe recent article published in a business periodical. A summary of the article and full bibliographical information is mandatory.
XI. Bibliography: All inclusive with specific page references.
List all references used in compiling the above report
III. Industry Template: Create a Table with two columns
Industry definition Market size and growth rate
Key rivals & market share
Scope of competitive rivalry
Concentration vs. fragmentation
Number of buyers
Demand determinants
Degree of product differentiation
Product innovation
Key success factors Supply/demand conditions
Analysis of stage in life cycle
Pace of technological change
Vertical integration
Economies of scale
Learning/experience curve effects
Barriers to entry Regulation/deregulation
Globalization Trends
You should be following me on Twitter and reading the pins that I send you from my Pinterest Boards; these are virtual handouts.

