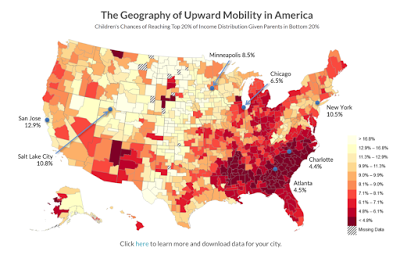
A crucial part of social cohesion is the prospect of social mobility across generations. A social order in which individuals are stuck in their social position as a result of the lack of social assets of their parents is one which lacks legitimacy for an important part of its population. (Here are a few earlier posts on social mobility in the United States; link, link.) This observation raises several crucial questions. How do we measure social mobility? What obstacles stand in the way of social mobility for some segments of a given population? And what mechanisms exist to increase the pace of social mobility for a given society?
Raj Chetty and his colleagues have profoundly changed the terrain for social scientists interested in these questions through a striking new approach. Their work is presented on the Equality of Mobility website (link). The map above shows that there are very sizable regional differences in social mobility rates, from the deep south to the plains states and upper midwest.
Of particular interest is the light their research sheds on the role that post-secondary education plays in social mobility. A summary of their findings is presented in an NBER research paper, "Mobility Report Cards: The Role of Colleges in Intergenerational Mobility" (link). Here is a statement of their approach:
We take a step toward answering these questions by using administrative data covering all college students from 1999-2013 to construct publicly available mobility report cards – statistics on students’ earnings outcomes and their parents’ incomes – for each college in America.1 We use de-identified data from federal income tax returns and the Department of Education to obtain information on college attendance, students’ earnings in their early thirties, and their parents’ household incomes.2 In our baseline analysis, we focus on children born between 1980 and 1982 – the oldest children whom we can reliably link to parents – and assign children to colleges based on the college they attend most between the ages of 19 and 22. We then show that our results are robust to a range of alternative specifications, such as measuring children’s incomes at the household instead of individual level, using alternative definitions of college attendance, and adjusting for differences in local costs of living.Their research involves linking federal tax returns for two generations of individuals in order to establish the relationship between the parents' income group and the child's income group after college. (The tax data are de-identified so that the privacy of the individuals is protected.) The Equality of Mobility website includes downloadable datasets for the report cards for several thousand post-secondary institutions.
A highlight of this analysis is the very substantial impact on social mobility created by regional public universities.
The colleges that have the highest bottom-to-top-quintile mobility rates – i.e., those that offer both high success rates and low-income access – are typically mid-tier public institutions. For instance, many campuses of the City University of New York (CUNY), certain California State colleges, and several campuses in the University of Texas system have mobility rates above 6%. Certain community colleges, such as Glendale Community College in Los Angeles, also have very high mobility rates; however, a number of other community colleges have very low mobility rates because they have low success rates. Elite private (Ivy-Plus) colleges have an average mobility rate of 2.2%, slightly above the national median: these colleges have the best outcomes but, as discussed above, also have very few students from low-income families. Flagship public institutions have fairly low mobility rates on average (1.7%), as many of them have relatively low rates of access. Mobility rates are not strongly correlated with differences in the distribution of college majors, endowments, instructional expenditures, or other institutional characteristics. This is because the characteristics that correlate positively with children’s earnings outcomes (e.g., selectivity or expenditures) correlate negatively with access, leading to little or no correlation with mobility rates. The lack of observable predictors of mobility rates underscores the value of directly examining students’ earnings outcomes by college as we do here, but leaves the question of understanding the production and selection technologies used by high-mobility-rate colleges open for future work. (3-4)These are by and large the institutions that constitute the membership of the American Association of State Colleges and Universities (link). AASCU institutions are distinguished by the commitment that they commonly share to enhancing access for under-serviced members of society, and to contributing to social mobility in the regions and states that they serve. These values are expressed in the American Democracy Project (link). The evidence of the Chetty project appears to validate the achievement of that mission.
There are additional questions that one would like to be able to answer using the kinds of data that Chetty and his colleagues have considered. Central among these have to do with other measures of social mobility. The definition of social mobility in use here is transition from the bottom quintile of income to the top quintile of income in one generation. But it would be illuminating to consider less dramatic social movement as well -- for example, from the bottom quintile to the middle quintile.
This research underlines the critical importance of public higher education in the United States. We need to do a better job of supporting public universities so that the cost of higher education is not so heavily skewed towards tuition revenues. The benefits of public universities are certainly of value to the individual graduates and their families. But the increased social mobility enabled by many public universities also enhances democratic legitimacy at a time when many institutions are under attack.
