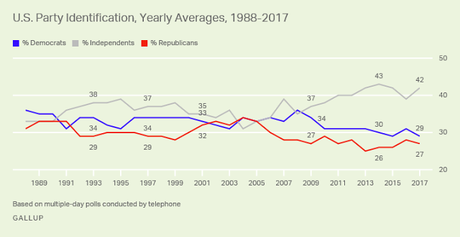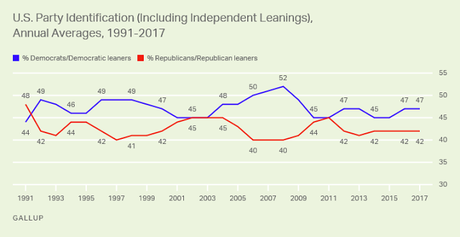

These charts are from a recently released Gallup Poll -- done in 2017 of a random national sample of 13,185 adults, with only a 1 point margin of error.
As the top chart shows, more people identify as Independents (42%) than identify as Democrats (29%) or Republicans (27%). That's a pretty large percentage, and it seems to show that a lot of Americans are angry with both political parties. But is that a reality? Are there really 42% who are truly Independent, and might vote for either major party (or a third party)?
No. The truth is that there aren't nearly that many true Independents. Most of the people calling themselves Independents actually lean toward (and vote for) one of the two major parties. The second chart shows the true breakdown (with leaners put in the party they prefer).
When the leaners are accounted for, the Democratic Party is the largest group at 47%, with the Republican Party finishing second at 42%. Only about 11% of the population are true Independents.

