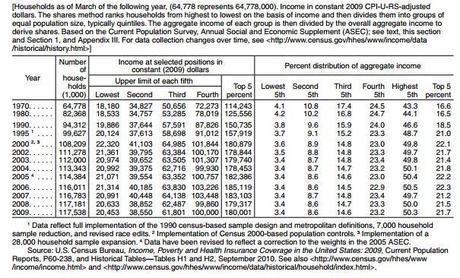
All the recent talk about reworking tax rates and closing tax breaks got me curious about how income is distributed across U.S. households. If you really want to dig into the topic, check out the U.S. Census Bureau website. The table below, however, will give you a good, quick glance at where we stand and how things have changed over the past few decades.
The dollar amounts have been adjusted to dollar values in 2009, the most recent year for which Census Bureau statistics are available. You’ll see that in 1970, the top 5 percent of households took in 16.6 percent of all the annual income in the United States. In 2009, that share had increased to 21.7 percent. To be in the top 5 percent of all U.S. households in 2009, you had to be bringing in at least $180,000 a year.
As we look for revenue sources to help address our country’s deficit, a consensus is building around the idea that our highest-income citizens should pay more income tax. I appreciate the contributions already made by our wealthiest citizens; don’t think for a minute that they are shirkers on income tax. As you can see here, the top 5 percent of earners pay almost 60 percent of federal income taxes. The top 10 percent pay 70 percent of federal income taxes. Even so, I agree that these individuals can and should pay more; they can afford to shoulder more of the burden, and they benefit from Bush-era tax breaks that originally were set to expire in 2010.
People see this as an issue of fairness for an understandable reason. Between 1997 and 2008, the top 10 percent of households captured all the income gains in the country. The rest of the nation has been treading water or losing ground.
The truth is, we’ll all have to suffer and sacrifice to get our country back on solid footing. After looking at these statistics – especially the data indicating that all the new income for a decade has ended up at the top of the pyramid – it seems both right and necessary that those at the top are going to have to pitch in a little more.


