In the age of millennials, the power of data is the driving force of every aspect of business. Businesses are growing more media-savvy to help their business, from artificial intelligence powered predictive analytics up to data-based operating systems, it is now possible for every business to execute different tasks with an instantaneous company data backdrops.
The same scenario applies to marketing. The most functional decisions in marketing right now are data-driven. Most of which are in accordion with strategies that generate the most traffic, the most conversions, or the most engagements. So, where do these marketing data come from? The answer is simple; they are from Google Analytics.
World of Analytics
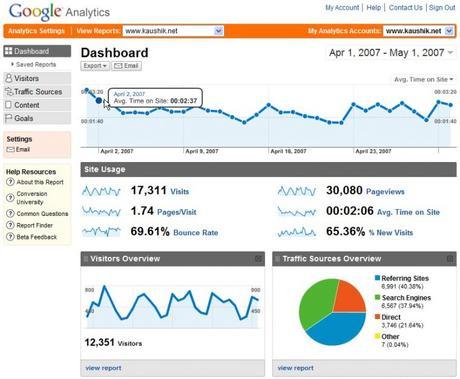
There's a good question that you might want to ask yourself. What is your yardstick when it comes to measuring the value and impact of the content that you are going to publish?
Fortunately for you, there are answers for every most of your questions that you have about the performance of your website. Very often, these answers lie on the algorithms of Google Analytics themselves.

There's good chance that you use this powerful tool to track key metrics like bounce rates, page views, and websites visits. What you don't know is that Google Analytics can dig deeper and provide more practical comprehension that can paint a clearer picture of your site's performance. Furthermore, analytics is also useful in achieving and revealing valuable opportunities for your website.
Convert Data Into Decisions
Google Analytics are very advantageous if you use them as support tools for decision making. Analytics can provide the answers to your concerns such as what's working and what's not on your site, as well as what actions you need to take as a result. To accomplish this, follow the steps below:
- Focus on an area for improvement with your site's performance. (What needs help?)
- Decide what questions to ask to support your ideas. (Figure out what you need to ask and answer)
- Make an action plan according to your analysis of that data. (Get a plan)
- Create an analytic report that contains sufficient data to answer that question. (Make report to give you helpful data)
- Quantify the results of your actions against the data baselines that you acquired. (Fix the issue and measure results after)
Four Reports To Rule Them All
These are the most useful reports to start with.
Audience reports: Understand the behaviors of your audience, their interests, and how they use the content that you create and publish.
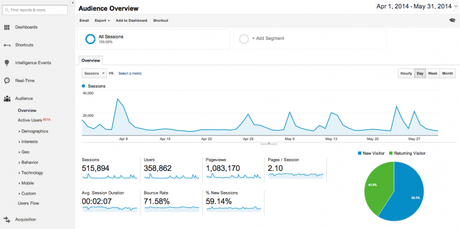
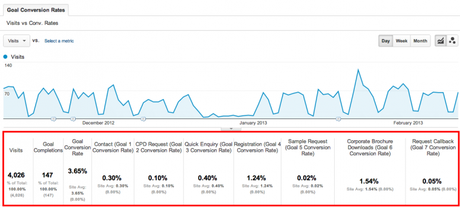
Conversion reports: Decide if the content that you post helps your business achieve its marketing goals, and find out which content which efforts render the best results.
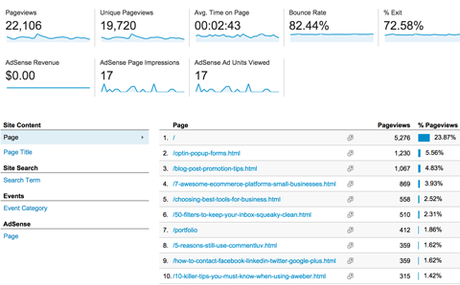
Behavior reports: Assess the actions of your site visitors, find ways to enhance their experience while visiting your website and maximize your content's engagement potentials.
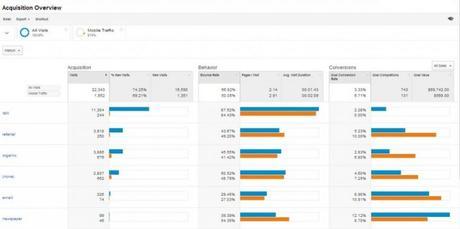
Acquisition reports: Obtain valuable insights on the search term visitors, and use them to discover content and the sources of the website's traffics.
Evaluate Platform Performance
The Most Frequently Asked Question: Are visitors using mobile devices less engaged compared to visitors of other platforms?
Report To Make: Mobile Overview. The cycle starts with Audience to Mobile then Overview.
The report from Mobile Overview displays the number of visits from mobile devices. Click the Comparison View button in the options selector if you want to check the rate of your mobile visitor sessions, their leverage to other platforms concerning engagement metrics like pages per session, average session duration sessions or bounces rate.
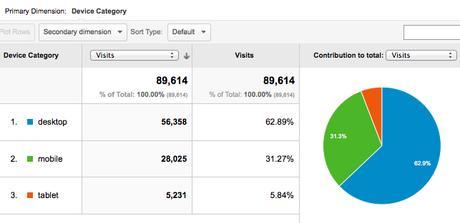
Sample analysis: If you have extreme high bounce rates among your mobile users, this may be your cue to improve the user experience on mobile of your site.
What You Can Do:- Make a regular schedule for mobile testing.
- Inspect the designs of the landing pages of your website and check if they are well-optimized and pleasing for mobile visitors.
- Social Media Traffic
- The Most Frequently Asked Question: Which social media platforms generate the best website traffics?
Report To Make: Channel Reports from Acquisition, All Traffic, And Goals having all of which filtered by a goal.
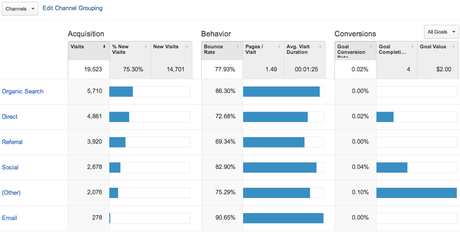
If you are considering traffic from social media platforms, the most efficient outlets are those that have high visitor conversion rates. It is necessary for you to check the data that are relevant to the specific conversion goals.
Notice that in the sample report below, LinkedIn earned first place with the highest conversion rate among the four popular social media platforms.
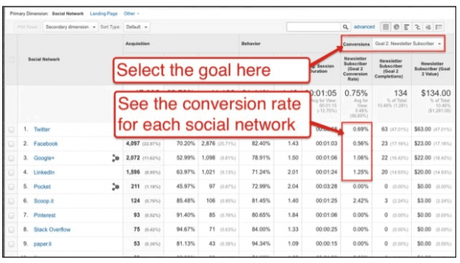
Sample analysis: You set up your goals for conversion in Google Analytics. Subscribe to your newsletter, complete a lead-gen form, download an ebook, etc. The reports that you make will serve as your reference data if you successfully meet your goals or not.
What You Can Do:
You need to focus on providing high-quality content for different social media outlets with high conversion rates.
Blog Post Engagements
The Most Frequently Asked Question: Which blog posts are the most interesting or engaging to the visitors?
Report To Make: Includes All Pages Report. The cycle starts from Behavior, Site Content up to All Pages.
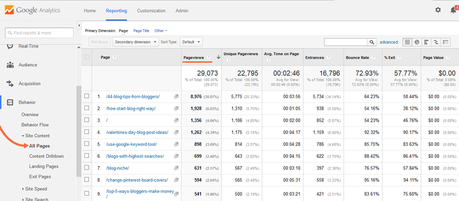
If the URLs (Uniform Resource Locator) of your website page are categorized according the url structure. If all posts are located within a /blog directory you can sort your blog posts by this method the advanced search box. Or simply sort All Pages by pageviews and see which pages bring in the most traffic.
What You Can Do:It may be a good ideas to create similar content that add more information to your posts/articles that are high traffic generators. You can also capitalize on the popularity of these articles by targeting lead-generation towards the audience for this article based on the information this article is providing.
Pathways For Site Navigation
The Most Frequently Asked Question: What is the typical path that visitors take in through sites?
Report To Make: Users Flow. The cycle starts with Audience to Users Flow.
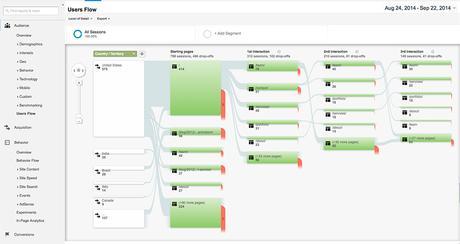
Analysis of the traffic flow through your site is valuable in providing insight as to what visitors of your site find and what they are looking for, as well as the locations they might be leaving the intended path up to the conversion.
If you check the User's Flow report, you'll see that green boxes represent various pages, and are organized into groupings, for example, site category, country, and publication year. The pages have labels in the same manner as the URLs. The pages that contain "/" indicates your home page.
The kind of report stated above may require more thorough explanation if you are not that familiar with finding and interpreting data.
Click the green box of your homepage or to any top pages of your site to see several options:
- Accentuate traffic using pages that show the traffic for that page while other pages are still showing.
- Research the traffic using pages that omit traffic data for other pages.
- There's Group Details that displays extensive information on the top pages that comprises that group.
Follow your path yourself from the options given above and discover the top path that visitors follow after arriving on that page. You can determine whether the flow of traffic aligns accordingly with the navigation path that you want them to follow.
Sample analysis: Incorrect turns on the path will tell you that you need to make it easier for the visitors to follow he content they like the most or emphasize your best-performing or highest value pages to keep them entertained. You can also motivate your visitors to explore your site further.
What You Can Do:If your conversion rates fail to make progress along with the conversion paths that you intend to hit, you can resort to the following options below:
- If your visitors are jumping from Page A to high drop off pages, you can clean polish Page A and remove links from irrelevant pages.
- The alternative option for you is to optimize Page A via reconsideration of internal links, the navigation features and calls to action highlight the desired path that is visually more entertaining and exciting to the visitors.
Forge Ahead And Analyze
Analyzing and keeping track of your performance data requires hard work and patience. It is not a one-time task. You might need to recheck and revisit these reports on a daily basis to make sure that the actions you take are generating positive results.
An in-depth understanding and analysis of your Google Analytics data is a necessary prerequisite to acquiring insights for boosting your website's rank and conversion. You have to make sure that you look at everything on your end to gain leverage from your competitors and stay on top of the competition. Apply the Google Analytics tips in this post to boost your data analysis and website optimization efforts.
Author Bio: Wade Cockfield is a successful entrepreneur and the founding father of CEO of Wade Cockfield Executive SEO Company based in Melbourne, Australia. His agency specializes in providing and developing high-quality marketing strategies to different companies. When he has free time, he indulges in writing and sharing his knowledge in marketing and SEO and shares them with his readers and followers.
