Apache JMeter is a fully open source pure java tool designed for the purpose of load testing and measuring performance of web applications. According to the documentation, it can be used to test both static and dynamic web resources such as files, Servlets, web services, Perl scripts, Java Objects, Data Bases and Queries, FTP Servers etc. JMeter can effectively use to simulate heavy loads on the above resource types and analyze the overall performance under different load conditions such as concurrent loads. It also provide various types of visualization techniques to graphically analyze the results obtained from the load tests.
Here are some advantages of using JMeter
- Open Source free tool developed by Apache Software Foundation
- Has an active community, good documentation, user manuals and plenty of resources which makes easy to learn, get start and running
- Can load test in variety of server types such as HTTP, FTP, SOAP, Database, LDAP, JMS, Mail servers etc.
- Support large-scale testing providing concurrency and ability to use various types of loads.
- Support for distributed stress testing using multiple systems
- API and plug-ins available for customization
- Provides variety of test results manipulation and visualization methods
Setting up the Environment
- JDK 1.5 or later version is required for JMeter latest released version 2.7. Get more details about tested JDK versions and compatible operating systems from here. You can go through my previous post to get more details about setting up Sun JDK 1.6 in Linux environment.
- Download JMeter binaries or checkout and build JMeter source available at repositories. Unpack the archive(zip or tgz) to a local folder. Let [jMeterHome] be the unpacked directory. Run JMeter from the terminal as follows.
- sh [jMeterHome]/bin/jmeter.sh [Linux] [jMeterHome]/bin/jmeter.bat [WIndows]
Setting up Apache Axis2 and deploy the service
Here we will be deploying sample service available in Apache Axis2 called StockQuoteService which provides two method calls.
package samples.quickstart.service.pojo;
import java.util.HashMap;
public class StockQuoteService {
    private HashMap map = new HashMap();
    public double getPrice(String symbol) {
        Double price = (Double) map.get(symbol);
        if(price != null){
            return price.doubleValue();
        }
        return 42.00;
    }
public void update(String symbol, double price) {
    map.put(symbol, new Double(price));
    }
}
You need to build the service definition file (StockQuoteService.aar) and place it in "[Axis2_Home]/repository/services" directory in order to deploy it as an axis2 service(Axis2 running in the standalone mode). If axis2 runs inside a servlet engine like Apache Tomcat relevant directory should be "webapps/axis2/WEB-INF/services".
Axis2 quick start guide and installation guide provides extensive details about creating and deploying services in different ways with Apache Axis2.
Since our purpose is to test the state replication in Axis2 cluster, we need to enable clustering from the axis2.xml in "[Axis2_Home]/conf" directory. To deploy a axis2 cluster, two(or any other number) axis2 instances shoud be started, where "domain name" is set to same value and state replication property is enabled. Make sure instances can communicate among each other, depending on the membership scheme used for clustering.
If we deploy the two instances in the same host, we need to change the "transport listener" and "localMemberPort" as well. In this scenario transport listener ports are set to "8080 and 8081" respectively in two axis2 servers which are running in the same local machine.
Start the axis2 servers as follows after configuring the axis2 cluster.
sh [Axis2_Home]/bin/axis2server.sh [Linux] [Axis2_Home]/bin/axis2server.bat [Windows]
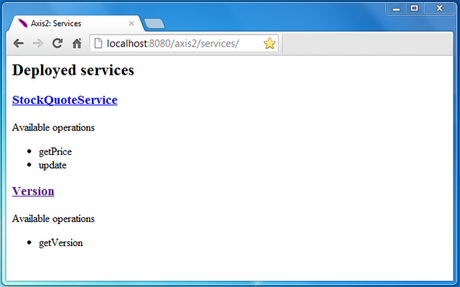
Then check to make sure that the service has been properly deployed by viewing the list of services at,
http://localhost:8080/axis2/services/listServices http://localhost:8081/axis2/services/listServices
Below is an snapshot of the browser in the above URL once you correctly deployed the service.
Figure 02. Deployed Axis2 services in the browser
Getting started with load Testing
a) Creating a test plan
Using the JMeter GUI, you can create various types of test plans including, Web service test plan, Database test plan, FTP test plan etc.
Test plan created trough the GUI is saved in .jmx format. Although test plan can be edited by following the JMeter xml schema, modifying the test plan using GUI is much easier.
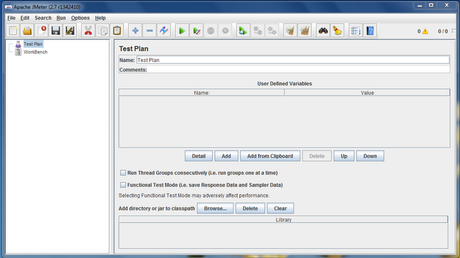
In the landing view of JMeter, there are two basic elements. i.e Test plan and Work bench.
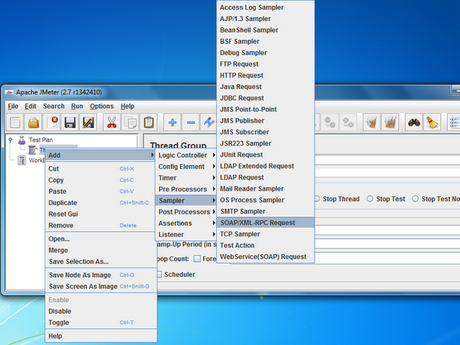
Right click on the Test plan and add a Thread Group element. Create two SOAP/XML-RPC Requests for two method calls associated with the StockQuoteService service.
b) Configuring the test plan
In the Thread Group element, set the thread properties,
- Number of threads(users) : No. of concurrent users to be simulated.
- Ramp - up period(in seconds) :Time taken by the JMeter to invoke the threads
- Lop count : No of times the test plan should be repeated.
Shown below are the steps to follow while adding above elements.
Figure 03. Adding Thread group
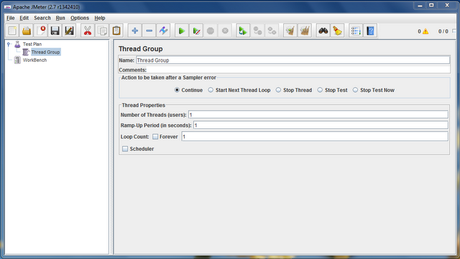
Figure 04. Adding SOAP/XML-RPC request
In the "updatePrice request", set service URL and the SOAP action properties as shown below. Set SOAP/XML-RPC data as,
<soapenv:Envelope xmlns:soapenv="http://schemas.xmlsoap.org/soap/envelope/" xmlns:xsd="http://quickstart.samples/xsd">Figure 05. updatePrice request view
<soapenv:Header/>
<soapenv:Body>
<xsd:update>
<!--Optional:-->
<xsd:symbol>?</xsd:symbol>
<!--Optional:-->
<xsd:price>${__Random(1,1000,)}</xsd:price>
</xsd:update>
</soapenv:Body>
</soapenv:Envelope>
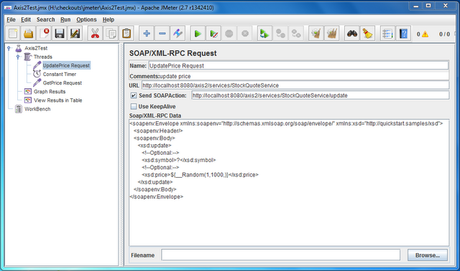
Here, updatePrice request will be send to a one instance running on port "8080" and the getprice request will be send to the other instance running on "8081" to test the state replication property of the axis2 cluster.
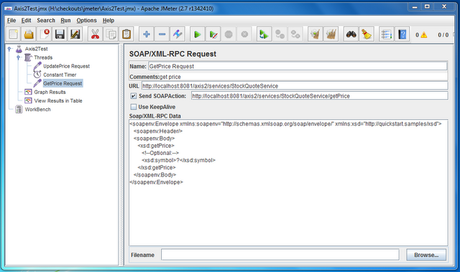
Similarly, set the relevant properties in the "getPrice request" element. Set the XML-RPC Data as,
<soapenv:Envelope xmlns:soapenv="http://schemas.xmlsoap.org/soap/envelope/" xmlns:xsd="http://quickstart.samples/xsd">
   <soapenv:Header/>
   <soapenv:Body>
   <xsd:getPrice>
   <!--Optional:-->
   <xsd:symbol>?</xsd:symbol>
   </xsd:getPrice>
   </soapenv:Body>
</soapenv:Envelope>
Figure 06. getPrice request view
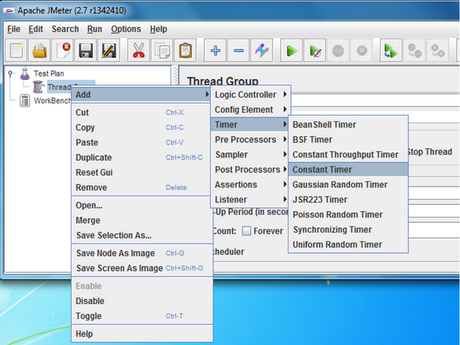
 Add a timer to set the "thread delay time". This can be a constant time or random timer such as "Gaussian random timer" to get a more realistic behavior of the system.
Figure 07. Adding a Timer Element
To visualize the data, we can add Listeners like "Graph results", "View Results in a table", "View results tree" and "Spline Visualizer". In addition we can also send the responses of the service requests to a file by adding a "Write results to a file" in the above element properties. This is an essential feature for debugging and examining errors.
c) Running the test plan
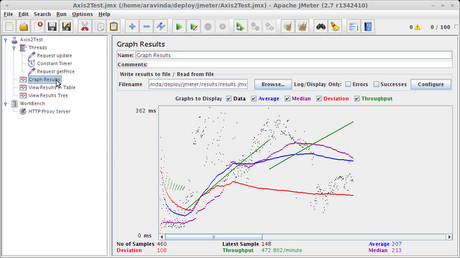
After all the required fields in the test plan filled, save it. Run the test plan from Run-->start or pressing ctrl+r. Use the "Graph results" element to view the chart which is being populated when the load test is running. Graph types like 'Data, average, throughput' can be enabled in the chart to get a clear idea about the test results. Here throughput means the number of requests processed by the server within a minute.
Figure 08. Graph results element view.
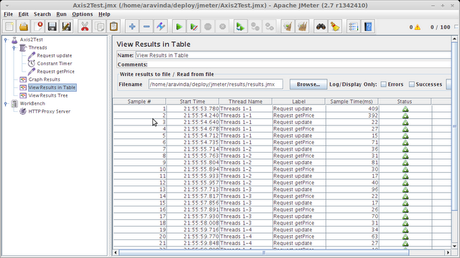
In the "View results in the table" element, status column illustrates whether service request completed successfully or failed.
Figure 09. View results in the table
To simulate high load on the server we can increase the no of threads and the loop count.


COMMENTS ( 2 )
posted on 08 October at 17:56
It's not my first time to visit this web page, i am browsing this web page dailly and get good information from here every day.
posted on 15 September at 13:09
Excellent pieces. Keep writing such kind of info on your site.
Im really impressed by it. Hello there, You have done a fantastic job. I will certainly digg it and for my part recommend to my friends. I'm confident they will be benefited from this website.