Many cryptocurrency investors remember well the altcoins’ boom in 2017. The most successful people then enjoyed the growth of their investments portfolio more than 10 times. Not surprisingly, due to the growing interest in the cryptocurrency market this year, many people are buying altcoins again. However, such investments are generally underperforming investment in Bitcoin.
The fact is that since the beginning of 2018, the share of Bitcoin in the total capitalization of cryptocurrencies has been steadily growing. There are the fundamental economic reasons for this phenomenon. First of all, we are talking about the growing adaptation of the largest cryptocurrency by the investment community. The option to buy and store Bitcoin is already developing classical investment giant Fidelity. Currently, active preparations are underway for the launch of the Bakkt deliverable futures platform, which, according to many analysts, could become one of the key milestones in the development of the cryptocurrency market.
However, it is also obvious that even the most durable trends in the financial market are changing direction. Sooner or later, altcoins will be able to take back at least a part of lost position again. Traders should meet this time prepared.
What is useful for a trader Bitcoin dominance chart
In this guide, we will offer a simple and very practical option for optimizing the performance using a fairly simple technical analysis of the bitcoin dominance chart. When the demand for Bitcoin is stronger, you will earn on a mono position. When altcoins become a favorite of the market again, you will not miss the moment to make money.
Bitcoin dominance chart can be easily found on the popular platform for technical analysis https://www.tradingview.com. To select the desired chart, you just need to enter the BTC.D ticker into the appropriate form.

TradingView’s BTC.D ticket
This chart does not display the price of any particular financial instrument. It is calculated directly by the TradingView platform and only demonstrates the percentage of Bitcoin in the total capitalization of the cryptocurrency market. Thus, BTC.D is essentially a complementary indicator for displaying the current balance of demand in the cryptocurrency market.
What the graph shows now
It is advisable to start the analysis of the current situation with a weekly timeframe, which will help to look at the global situation.

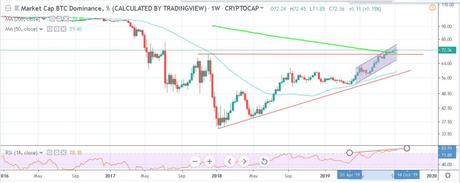
We see that in 2018 the long uptrend began. It is important to note that the dominance of Bitcoin began to grow during a period of the long-term market correction, which lasted throughout 2018. However, the change in the trend this year has not affected the balance of power.
The picture so far is in favour of continuing the trend. It’s too early to talk about testing the main support levels. Besides, the bulls managed to gain a foothold above the 200 MA. This means that when deciding on a medium-term and long-term investment in cryptocurrency, those who prefer bitcoin still win.
Selecting entry points
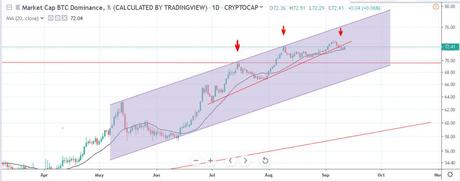
If you are not a long-term investor, then you can consider the possibility of speculative relocation of part of the capital in altcoins during BTC.D corrections. To clarify the method, we turn to the 1D time frame.

Here the author is turning to his trading practice. I use a very simple strategy based on intra-channel trading. Upon reaching the upper border of the channel, I sell part of BTC and buy 3-4 top altcoins. I close my positions in altcoins again when the price crosses the 20 MA from the bottom up or reaches an important support line. Also, local support lines are formed inside the channel, the breakdown of which is also a good signal.
For such speculative earnings, I use from 10% to 20% of the cryptocurrency portfolio. The share of altcoins remains small since the global trend is still bullish. A signal that the altcoins’ season has come and I can increase their share in the portfolio to 50-60% will be a breakdown of the lower border of the ascending channel.
It is important to note that my underlying asset in crypto trading is BTC, in which I measure my profit. If your underlying asset is USD, the strategy is a little more complicated. In this case, you should take into account the cryptocurrency market capitalization chart, which can be found on tradingview.com by a TOTAL ticker.
In the end, I will say that the above strategy is far from the only and, probably, not the best on the market. The purpose of this article is to draw the attention of traders to the additional indicator that helps to improve their crypto trading performance. Eventually, everyone will be able to adapt their own strategy for using Bitcoin Dominance chart.

