There has been no repudiation of the fact that Microsoft Excel is perhaps the most important computer software program used in the workplace today. It is pretty much a requirement these days. The people who use Excel only knows the substance of how to create a chart in excel. Along with Charts, you can also create great looking bar graphs on Excel which also works great for presenting data.
Every business needs tools to manage their data, and there is no more effective tool than Excel, for the same. Excel helps to collate and analyze the information quickly and effectively. Charts help you to visualize the data quickly.
Whether its bar and column charts or scatter and line charts or pie charts, each one of them has their own specific set of use and importance. Let’s look at the process of how to create charts in Excel:
Fetch the Data into the Excel
The fist and the foremost part is to input your data into Excel. To enter data in Excel, just select a cell and start typing. The text will appear both in the cell and in the formula bar above. The process of entering data into Excel is not at all difficult. In order to enter text or number in a cell:
- On the worksheet, click a cell.
- Type the numbers or text that you want to enter, and then press ENTER or TAB.
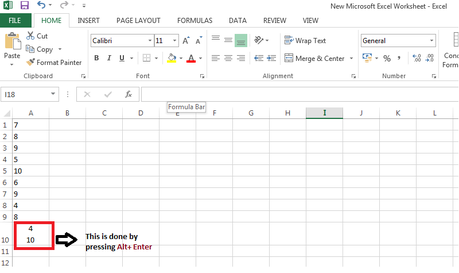
- To enter data on a new line within a cell, enter a line break by pressing ALT+ENTER.
You can also create a separate data to show the average of the numbers. You can easily calculate the average on Excel.
Choosing the Chart Type
It is advisable that before selecting the data, you wish to graph, get an idea of what chart type would best display your data. In short, entering the data depends on the type of chart you want to create.
In case you plan to create multiple chart types for displaying your data, choose the chart type that will help to visualize the patterns in the best possible way. The most popular chart types in Excel are as follows:
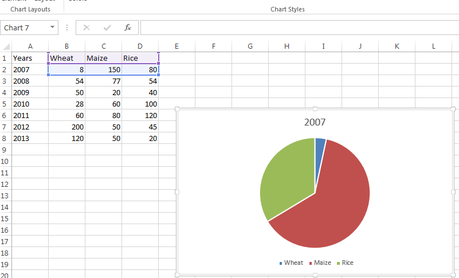
- Pie Chart- A pie chart is a circular chart that is divided into sectors which is proportional to the quantity it represents. It is best to use when you want to compare values in a single series as percentages of a whole, i.e. it is a good way to show relative sizes.
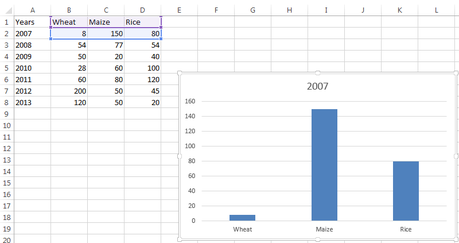
- Column Chart– It is a vertical bar column that displays values for one or more series over time or another category. It is effective in comparing values for multiple series.
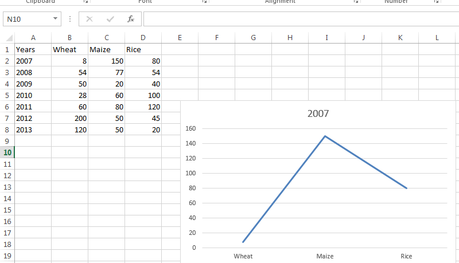
- Line Chart– It displays values as equally spaced points connected with a line. Basically, it visualizes data that changes over time. The key to a line chart is the time component.
- Bar Chart- It uses horizontal columns to display values for one or more series. It is exactly the same as a column chart only the x-axis and y-axis are switched.
Selecting Data in lieu of How to Create a Chart in Excel
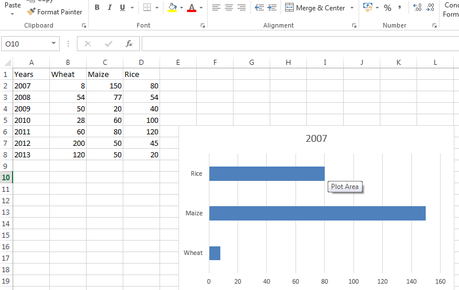
Now, select the cells that contain the values you want to show in the chart. You need to click and drag the cursor from the top left cell to the bottom right cell of the worksheet. Wherever possible, try to include column and row headings too.
How to Create Charts in Microsoft Excel
After you have selected the cells, for creating charts in Excel follow these steps enlisted below:
- Click the Insert Tab.
- Next, select the chart type from the Charts section of the ribbon.
- Click the desired chart sub-type. The chart appears on the worksheet.
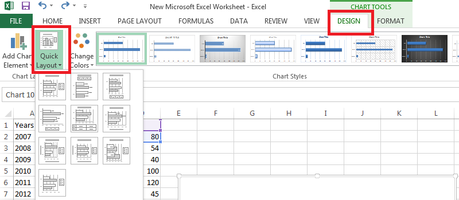
In case you want to change the layout, go to the “Design Tab” in the ribbon and click on Quick Layout. From here you have chosen from different types of layouts for the chart. It gives you access to experiment until you get the desired location.
Making Changes in the Charts
In case the size of the chart is not as you desired, Excel comes with various options, using which you can resize the charts, as necessary.
- Resize a Chart– You can resize a chart, by moving your mouse over the sizing handles. Just select the chart and drag any of the chart’s corners.
- Delete a chart- In case you want to delete a chart, click the Excel Undo button. To delete an existing chart, select the chart and press the Delete key, or right-click and select Cut.

- Moving a chart- It is very simple, just select the chart and drag it to the desired location. In case you want to move a chart, altogether to a new spreadsheet in the same workbook, select the chart, right-click on it, and select Move Chart. Type in the new sheet name and just click OK. If you have wrongly entered the data, here is how to transpose in Excel.
Streamlining the neatness of Charts
The messy charts can deplete the whole purpose of creating a chart. The meaning of the chart gets lost, in case it is displayed poorly. To avoid the same, follow these tips:
- Long Y-axis labels, take up a lot of space, thus shorten them, by making right-click on one of the labels on the Y-axis and choose “Format Axis” from the menu that appears. Choose “Number” from the left-hand side, then select “Custom” from the Category list. Enter the custom format code and click “OK” to close. It brings neatness to the graph.
- It is preferable to use multiple charts to express patterns and relationships between data than to use one chart, as it gets over-complicated.
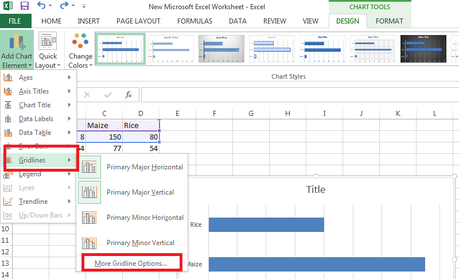
- Background lines can distract the reader, thus, remove these lines from the chart. For this choose “Chart Layout” then select “Gridlines,” then choose “No Gridlines” under “Horizontal” and “Vertical” options.
Conclusion
For any business activity, data collection and representation is a factor that one cannot ignore. Presentation of this data needs to equally convincing. Charts help one in this regard. Just follow the above-enlisted methods in order to How to create a chart in excel. If you have really big data and you want to sort the data, here is how you can Alphabetize the data on Excel.
There is a lot more you can do with charts in Excel. Be creative, customize and create your own excel chart templates, for that extra edge. Just be specific and pick the right chart that suits your purpose.
So in order to manage the abstruse data, build great charts and enjoy the applause.

