Religion Magazine
I have enjoyed the feedback, especially on twitter, from lots of people since I dusted down the blogging machine and reignited it earlier this week. I should blog more often! I had forgotten how much fun it is.
Anyway, this is the third post in the current series; cf. post one and post two.
Before continuing with critical reflections on Matthew Larsen's Gospels Before the Book, I'd like to pause to think a bit more about how we represent degrees of similarity between the Synoptic Gospels. This has been one of the most enjoyable take-aways from reflecting over the last couple of days. Larsen produced a proportional Venn diagram (p. 104) of the degree of similarity between Matthew and Mark in a bid to show just how similar these works are. He uses the pericope divisions in Aland's Synopsis. Here's my coloured version of his diagram, using my Synoptic colouring scheme: [2]:
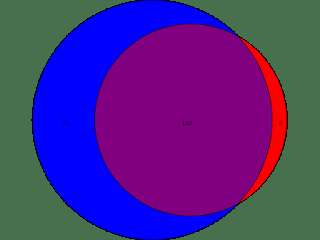
Key:
Matthew's non-Marcan material (blue)
Mark's non-Matthean material (red)
Material shared by Matthew and Mark (purple)
The numbers:
Mark: 115 Aland pericopae
Matthew: 178 Aland pericopae
Overlapping: 107 Aland pericopae
93% of Mark is paralleled in Matthew.
60% of Matthew is paralleled in Mark.
The diagram, though rough and ready, provides one metric for seeing how closely related Matthew is to Mark. The question then arises: what about Luke's relation to Mark? How close is it? Here's the proportional Venn diagram, again using my colouring scheme:
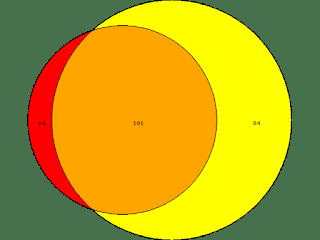
Key:
Luke's non-Marcan material (yellow)
Mark's non-Lucan material (red)
Material shared by Mark and Luke (orange)
The numbers:
Mark: 115 Aland pericopae
Luke: 185 Aland pericopae
Overlapping: 101 Aland pericopae
88% of Mark is paralleled in Luke.
55% of Luke is paralleled in Mark.
These figures are surprisingly similar to the figures for Matthew, surprising as Matthew is often regarded as so much closer to Mark, a kind of "second edition" of Mark. To some extent, this is a result of using the Aland pericopae rather than the traditional verse parallels, but I look forward to running some more precise numbers in due course.
The thing that got me thinking afresh about this whole question was Larsen's comment that "there are no two works from the ancient world more similar to each other" than Matthew and Mark. As I mentioned the other day, I am not sure if this is right. Matthew and Luke are much more similar overall, but we tend to miss this because of classic Two-Source Theory thinking that minimizes their macro-similarities, and projects their close non-Marcan agreements onto a non-extant source, with a view to maintaining their independence from one another. Here's the proportional Venn diagram, again using my colouring scheme, and again using the Aland pericopae:
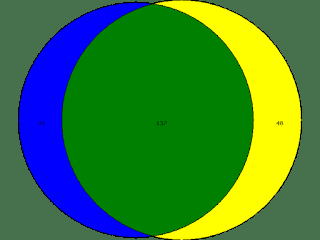
Key:
Matthew's non-Lucan material (blue)
Luke's non-Matthean material (yellow)
Material shared by Matthew and Luke (green)
The numbers:
Matthew: 178 Aland pericopae
Luke: 185 Aland pericopae
Overlapping: 137 Aland pericopae
74% of Matthew is paralleled in Luke.
77% of Luke is paralleled in Matthew.
I am grateful to Joe Weaks on The Macintosh Biblioblog (this is all wonderfully nostalgic!) for raising the question about the utility of traditional Venn diagrams like this. His suggestion is to work instead with rectangles:
Graphically Displaying Synoptic Data
This post shows how we can attempt to represent Matthew // Mark, Mark // Luke, and Matthew // Luke using coloured rectangles. I must admit that I really like Weaks's proposal, and not just because we use the same color scheme. The only thing I'd say is that I think it would be harder to do the rectangle thing in black and white because it would be less clear that we are dealing with overlapping rectangles, whereas with circles, it is obvious even in black and white where one work ends and another begins.
Weaks continues by asking the next major question: can one represent the overlaps between all three Synoptics using the coloured rectangle approach? Weaks shows that it is possible here:
Graphically Displaying Three Synoptic Gospel Data
This diagram is also excellent. My only qualm is that on first sight, it can look like the double tradition (green) is also part of the triple tradition (brown), which is of course not the case, and one simply has to discipline one's mind not to see it that way, though of course in a more complex version one could at least attempt to depict with shades of color pericopae that are pure triple (with only a handful of minor agreements), pure double (with no Marcan agreements), and everything in between. But life is probably too short for that.